Many of my readers' and viewers' questions remind me of the Whitney Houston song, "How Will I Know?". With the DecisionPoint Scoreboards starting to move "green", it begs the question, "Is the market on its way back up?" I believe I answered part of that question in Thursday's DecisionPoint blog but I went into detail during last Wednesday's webinar. In the current market environment I don't see a quick end to this bear market. Looking at the indicator charts below confirms this.
I narrowed it down to a select few charts to watch.
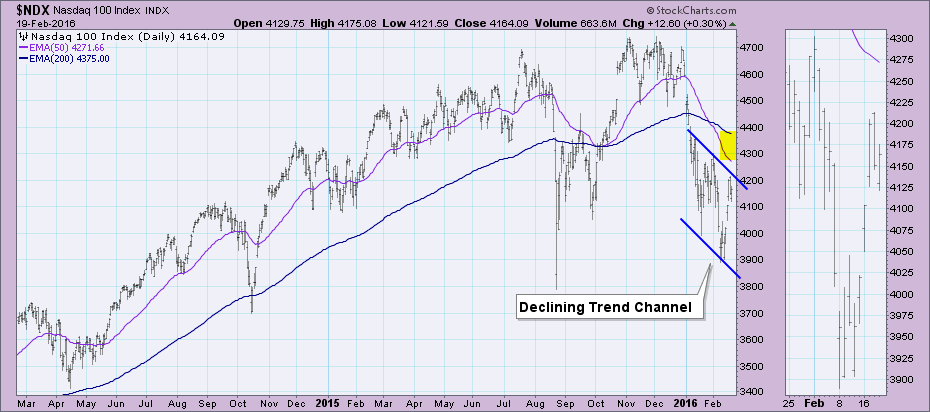
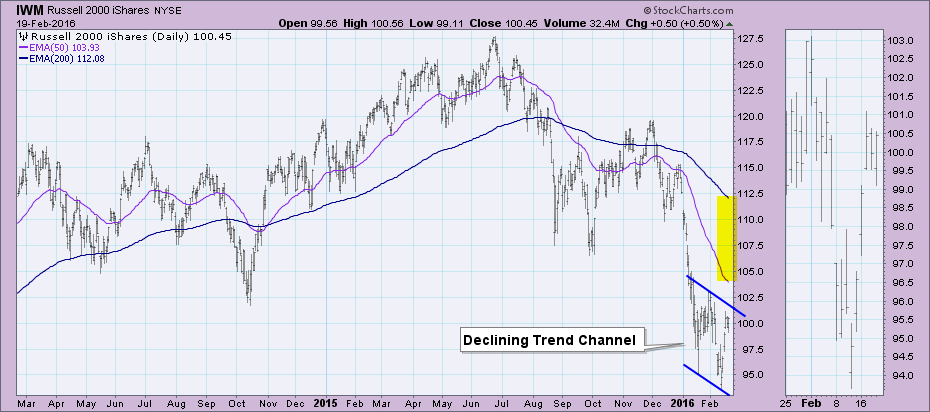
Early indications would be an Intermediate-Term Trend Model BUY signal on Small-Caps and the Nasdaq 100 which are suffering more than the other indexes. This signal would be triggered by a 20/50-EMA positive crossover. Price would need to steady itself above the 50-EMA for this to be possible. Note the margin between these EMAs currently.
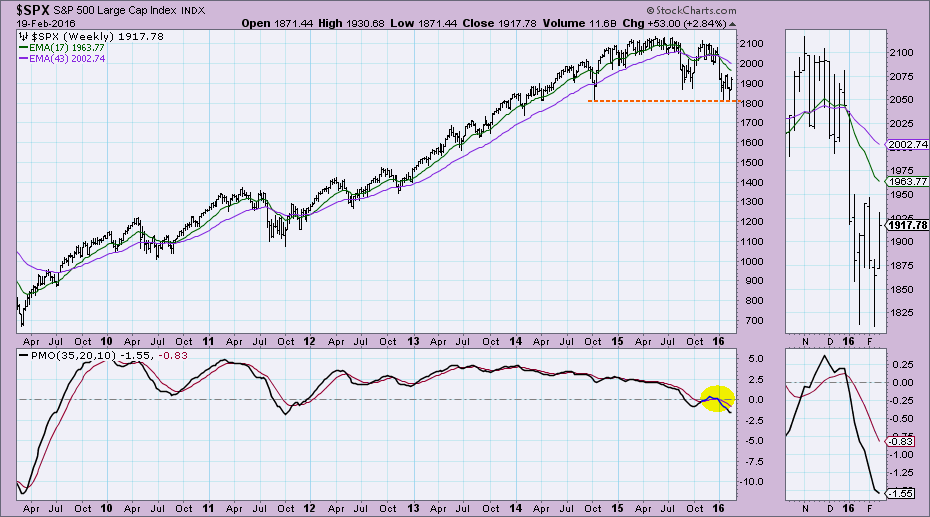
Second, the weekly Price Momentum Oscillators (PMOs) need to have a positive crossover. Look at the S&P 500 weekly PMO. It moves very slowly. It is still declining and while it appears it decelerated slightly this week, it needs powerful positive momentum to swing it the other way. Additionally, the weekly PMO is hardly oversold when you compare it to the previous bear market.
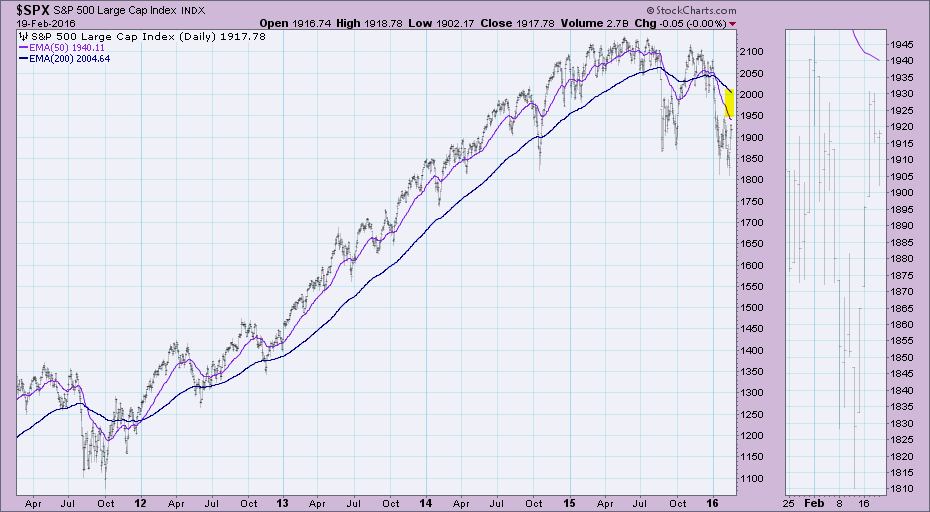
Finally, DecisionPoint deems that a bear market ends when the 50-EMA crosses back above the 200-EMA. I think it is clear from the charts below, that is a long way off. Price not only would have to rise above the 200-EMA, it would need to stay there long enough to pull the 50-EMA up and across the 200-EMA.
Conclusion: Clearly we are not at a turning point in this bear market. Keep an eye on the indicators and of course, join my free webinars where you'll definitely get a jump on what these indicators are up to each week.
Come check out the DecisionPoint Report with Erin Heim on Wednesdays and Fridays at 7:00p EST, a fast-paced 30-minute review of the current markets mid-week and week-end. The archives and registration links are on the Homepage under “What’s New”.
Technical Analysis is a windsock, not a crystal ball.
Happy Charting!
- Erin
