Yes.
Does that mean the stock market is guaranteed to roll over and play dead? Absolutely not. Trading success is not always dependent on being right, as crazy as that might sound. It's about planning your trades to minimize risk in the event your call is incorrect. Many times it "feels" good to short after the market has already fallen for several days in a row because that's when you feel most bearish. But truly the best time to short is when the market reverses in a counter trend rally for a period of time and approaches key price, gap, moving average, trendline, etc. resistance. Two weeks ago I posted an article here in this blog that suggested the rally in the NASDAQ could easily run into the 4600s, possibly even to test the declining 20 week EMA on the long-term chart above 4700. Below are two charts that show you can use a combination of short-term charts and long-term charts to identify key areas of resistance, from which to short.
Let's stick with the NASDAQ. First, I'll provide the daily chart and illustrate how the positive divergence played out to reset its MACD as it tested its 50 day SMA:
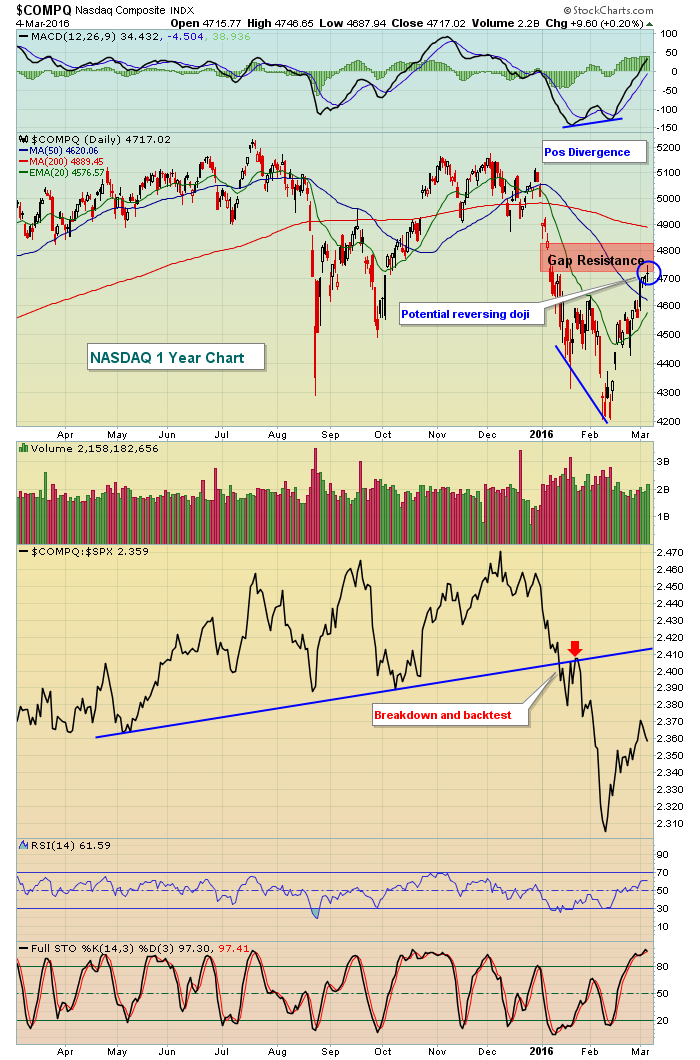 The daily MACD has stormed past centerline resistance and, on the surface, this would lead us to believe that price momentum is accelerating to the upside. Technically that is the case, but remember the MACD looks only at price, not volume. So can we truly rely on this centerline crossover without considering volume and the big picture? Volume on Friday was strong, but that occurred with a reversing candle (doji) and as we tested the bottom of gap resistance. That's only part of the problem, however. Here's the weekly chart - take a look at the close vs. the 20 week EMA that I mentioned could be tested a couple weeks ago:
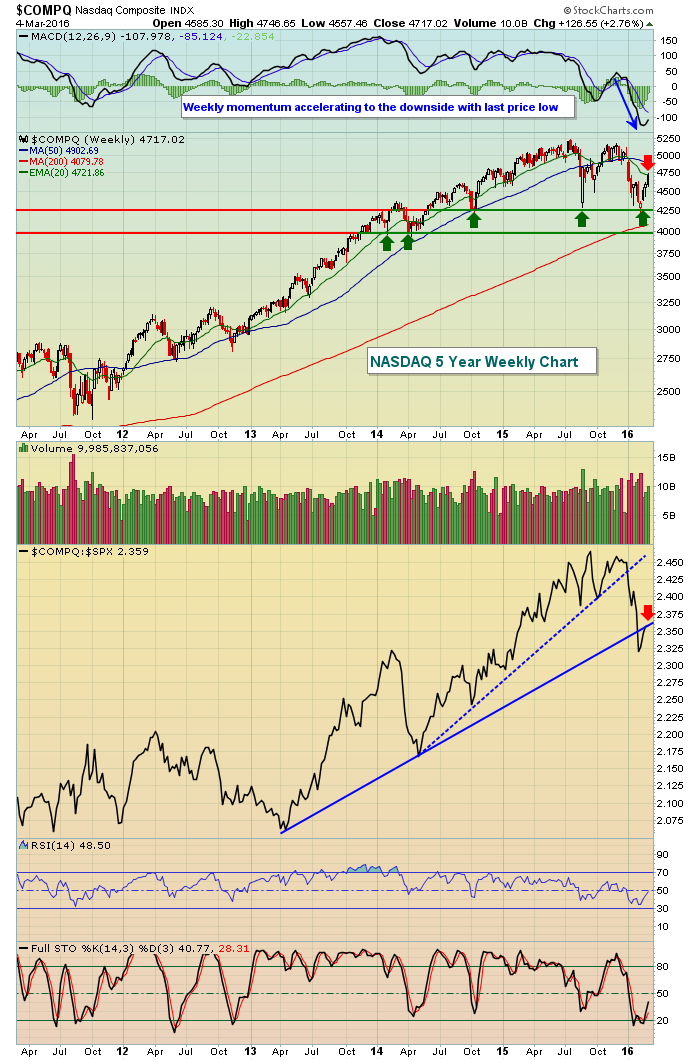 The relative strength of the NASDAQ has broken a two year uptrend line, as well as a three year uptrend line. The weekly MACD is absolutely horrid. Generally, when a weekly MACD is pointing straight down as it was when the last low printed, rebounds are contained the declining 20 period EMA. Currently, the 20 week EMA is at 4722. The NASDAQ hit 4747 intraday on Friday, but failed on the weekly close to pierce that 20 week EMA.
I'll be looking for a few signals next week to determine whether the next leg of a bear market begins.....or if the bulls resume command and look to extend the seven year bull market. On Friday, I posted a relative ratio chart to keep an eye on in my daily Trading Places blog. You can CLICK HERE to view the entire article.
Shorting seems like a high reward, low risk strategy at the current level. As always, I'd keep stops in play, however, as the best technical setups often times fail. Managing risk is critical.
Happy trading!
Tom
