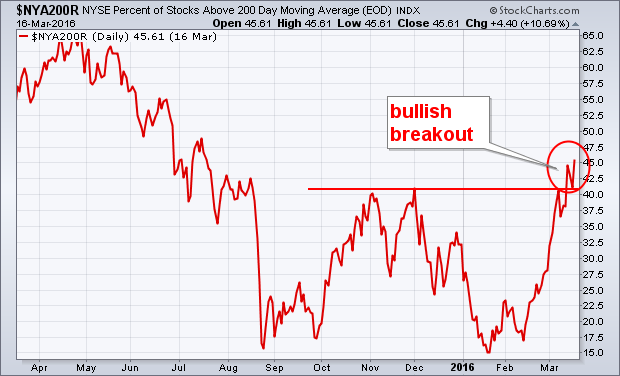
NYSE PERCENT OF STOCKS ABOVE 200-DAY MOVING AVERAGE TURNS UP... The previous Wedneday's message showed the % of NYSE stocks trading above their 200-day moving average moving up to challenge its fourth quarter high around 40% (after bottoming in January in oversold territory below 20%). Chart 9 shows the percentage figure having broken through that fourth quarter barrier to reach the highest level at 45% in eight months. That's a positive sign for the market. A further move above 50% would be even more positive.
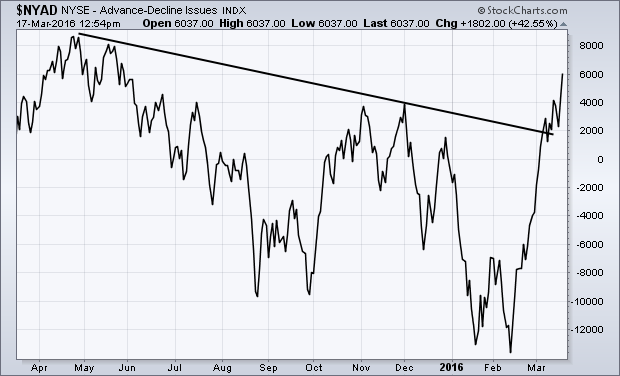
 NYSE ADVANCE-DECLINE LINE BREAKS OUT... The same message from last Wednesday showed the NYSE Advance-Decline Line moving up to test its fourth quarter high. Chart 10 shows the NYAD having broken through that fourth quarter peak to reach the highest level since last May (when the market itself started peaking). Last spring, the NYAD line led the market lower. Now, it's leading the market higher. That upside breakout also strengthens the view that the stock correction that started last May has ended, and that prices are headed higher.