Hello Fellow ChartWatchers!
Well, I don't know about you, but I'm impressed. Last week, the current rally moved higher and gained more momentum. After briefly (very briefly) pausing at its 200-day moving average, the Dow surged higher and obliterated the rounding-top concept I've talked about in the past. There is still lots of overhead resistance that can cause problems for this uptrend - especially around 17,750 - but so far there is no evidence that the market is paying attention to the past right now. Here's the final(!) version of my weekly Dow "rounding-top" chart:
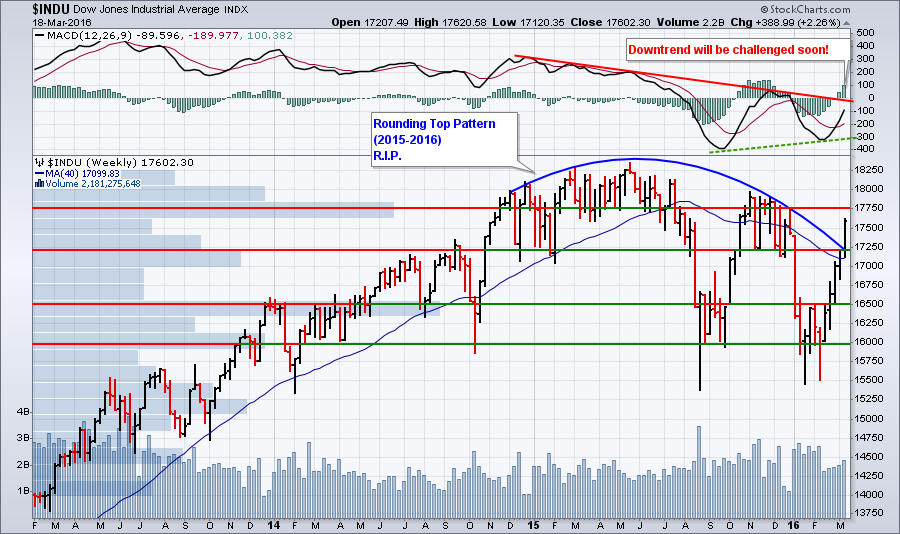 For those that haven't seen this chart before, the histogram bars sticking out from the left side of the chart are "Volume by Price" bars that show the total amount of volume that occurred whenever the stock closed within the vertical range of the histogram bar. The fact that the histogram bar containing 17,750 is much longer than its neighboring bars tells us that lots of volume has happened in the past near that level - and thus, 17,750 will probably act as a support/resistance level in the future.
Two other quick things to notice on this weekly chart - the MACD is still in negative territory although that might change soon and weekly volume continues to increase although it is still below January's levels.
There's No Such Thing as "Overbought"
(Or "oversold" for that matter.) The point of this admittedly controversial headline is that as technicians our primary goal is to find and ride trends. Let me say that again. Technical analysis' primary goal is to find stocks that are trending and then take advantage of that trend. Assuming you don't short things (please don't), then the only way to make money as an investor is to buy low and sell high - i.e., ride an uptrend.
Given that finding and riding uptrends is our primary mission, once you are riding an uptrend, why would you ever get off of it before it reverses? This is where the concept of "overbought" can work against you. Once a stock has moved up for any significant amount of time, there will be many technical indicators that will start to flash the "overbought" signal. This is very common with what are called "bounded oscillators" - indicators that have upper and lower value limits. Examples of bounded oscillators include the RSI oscillator and the various Stochastic oscillators.
There is an expression I like to remind myself of whenever I look at a chart with lots (too many) indicators:
"Oscillators oscillate."
This brilliant insight reminds me that many technical indicators go up and down frequently - even if the stock is continuing to move higher. They can't help it. They were designed to work that way. (In reality, they are meant to be used when a stock is moving sideways, not when it is in an uptrend.)
My point is this: Right now, because of the current strong rally, there are lots of stocks out there that are in "overbought territory." That expression implies that you shouldn't buy any of those stocks. That's bunk. As technicians, our job is to find and ride trends. Currently, the market is in a strong trend that is demanding to be ridden.
How? Ignore the oscillators and focus instead on momentum (MACD, PPO, PMO) and relative strength (SCTRs) - two things I have written about before. As long as momentum is increasing and the SCTR value isn't falling, ignore any "overbought" signals you may hear about. Strengthening momentum and strengthening relative strength are the key.
(And yes, even during this strong uptrend everyone should use solid risk management techniques like the ones found in Alexander Elder's eBook "Step-by-Step Trading.")
Uptrends do not get much stronger than what is currently on the charts. If you are not in this market right now, you need to do some soul searching and ask yourself the serious question "What else would it take for me to pull the trigger?" During last week's ChartWatchers webinar, I said that it was time for risk-takers to get in. At this point, there's very little left for this uptrend to prove.
Happy Easter everyone!
-- Chip
