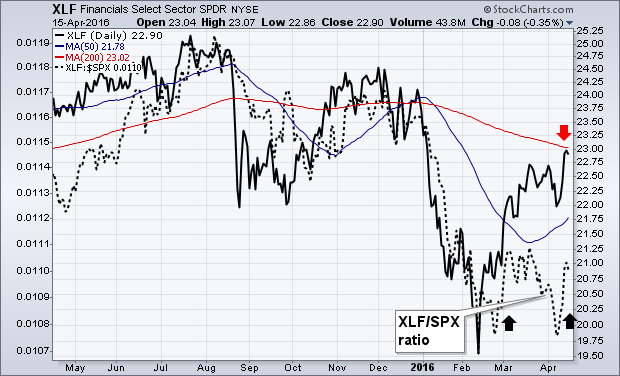
FINANCIALS HAVE A STRONG WEEK... Financials went from the year's weakest sector to the strongest gainer this past week. Chart 1 shows the Financials Sector SPDR (XLF) climbing to the highest level in three months and challenging its 200-day moving average (red arrow). The dotted line, which is the XLF/SPX relative strength ratio, jumped this week for the first time since February. Banks played a big role in the week's rally, as did brokers and life insurers. The market usually does better when financial stocks are helping.
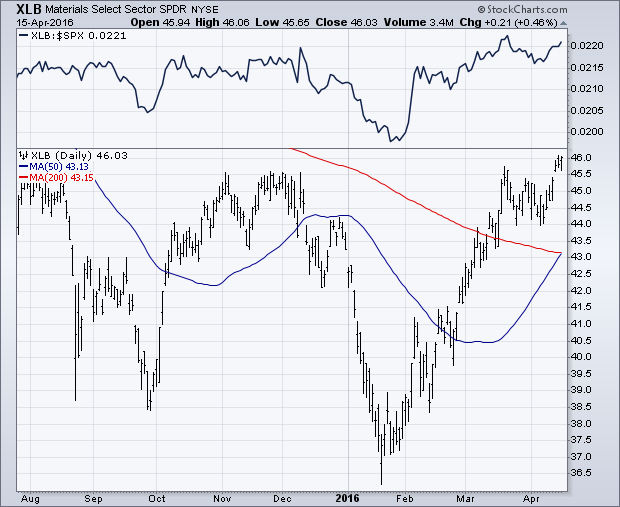
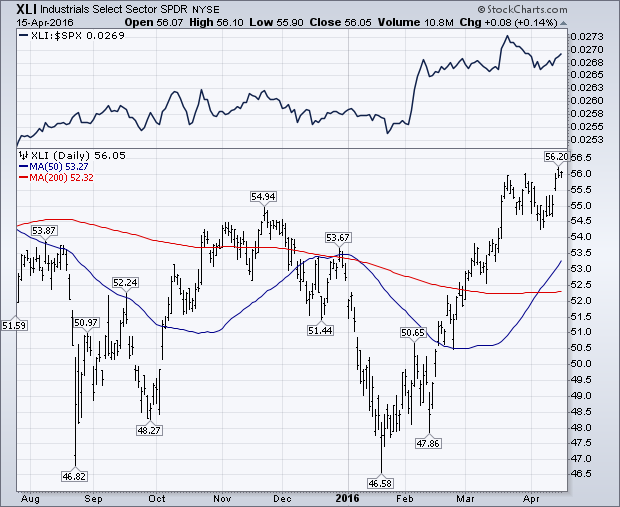
MATERIALS AND INDUSTRIALS ALSO LEAD... It's also encouraging that economically-sensitive materials and industrials are leading the market higher. Chart 2 shows the Materials Sector SPDR (XLB) closing above its fourth quarter high. Its relative strength line (top of chart) turned up in February. The XLB is being led by stocks tied to industrial commodities like aluminum, copper, and steel. That's a good sign for the global economy. Chart 3 shows the Industrials Sector SPDR (XLI) also closing above its fourth quarter high with a rising relative strength ratio. A 3% gain in transportation stocks contributed to the XLI performance. Consumer discretionary and energy stocks also showed relative strength, while defensive consumer staples and utilities underperformed. Staples were the only group to lose ground during the week. That shows a more optimistic market mood. Also encouraging are stronger gains in smaller stocks.