ChartWatchers June 19, 2016 at 09:22 AM
Hello Fellow ChartWatchers! Lots of changes in the wind these days both in the stock market and at StockCharts.com... Read More
ChartWatchers June 18, 2016 at 05:52 PM
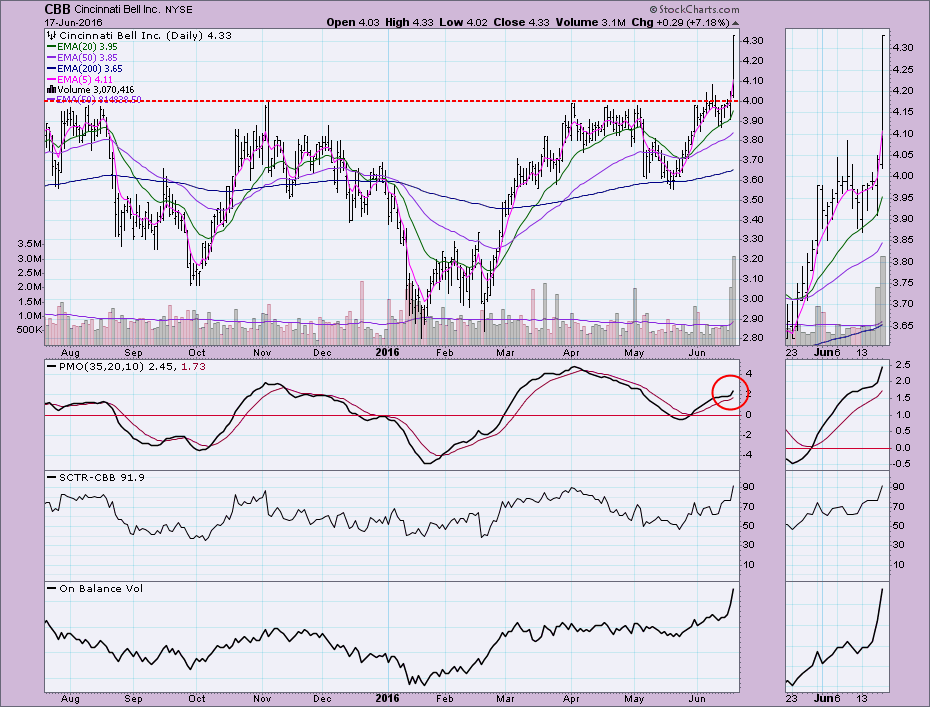
I wrote an article on Cincinnati Bell (CBB) at the end of May. I stated back then that a move to $4.00 was likely. The Price Momentum Oscillator (PMO) had bottomed but had yet to deliver a BUY signal. Since then CBB has gone through a few changes... Read More
ChartWatchers June 18, 2016 at 04:04 PM
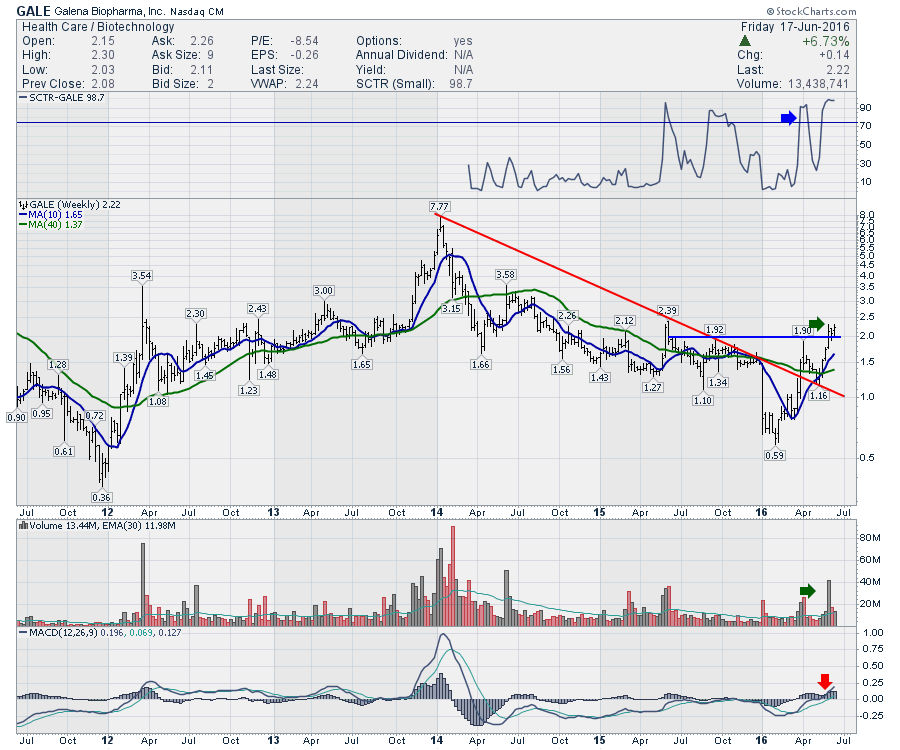
In a world of aging populations, the biotechs offer a promise of improving our quality of life. For the last year, biotechs have moved convincingly lower. However, there always seem to be some that have their own inertia... Read More
ChartWatchers June 18, 2016 at 01:15 PM
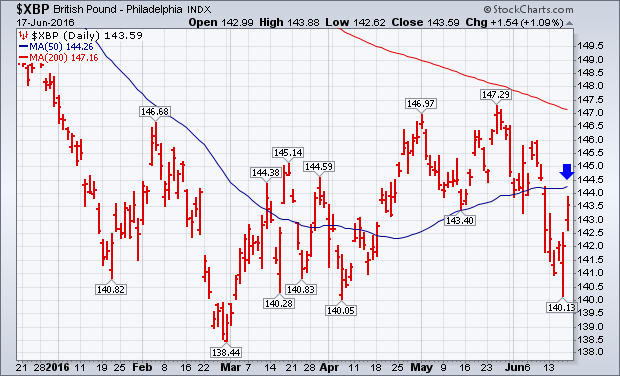
All eyes are on the British Brexit vote this coming Thursday (June 23) on whether to stay in the European Union or leave. Latest polls show the "leave" vote in the lead... Read More
ChartWatchers June 18, 2016 at 01:08 PM
Last week was rough on stocks as fear engulfed the market. All of the major indexes remain below key technical levels with the NASDAQ in particular very weak... Read More
ChartWatchers June 18, 2016 at 05:43 AM
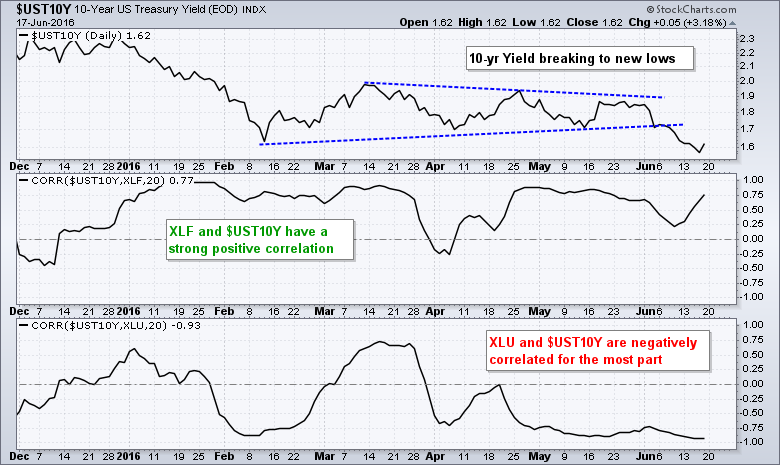
A sharp decline in Treasury yields is lifting the Utilities SPDR (XLU) and weighing on the Finance SPDR (XLF). First, let's look at the correlations to better understand the relationships... Read More
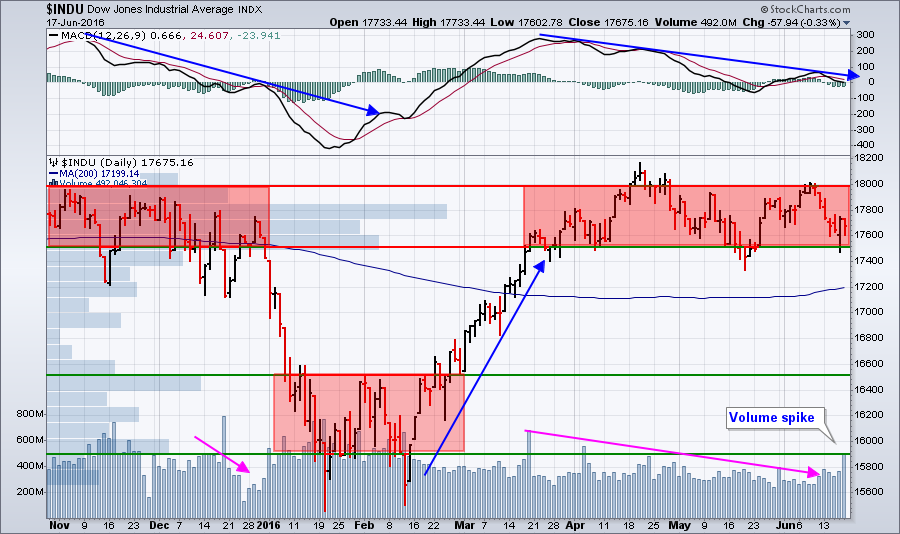
ChartWatchers June 05, 2016 at 11:25 AM
Hello Fellow ChartWatchers! The markets continue to move sideways with declining volume - both in the long-term view and in the short-term view. Since April, the Dow has been content to drift aimlessly between 17,500 and 18,000... Read More
ChartWatchers June 05, 2016 at 10:39 AM
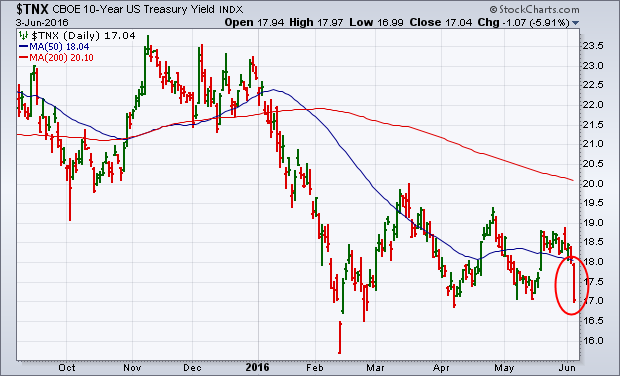
Friday's job report of only 38,000 jobs created in May was the weakest in more than five years. And it pretty much shocked everyone. Some of the market reactions, however, were reasonably predictable. Interest rate yields tumbled along the entire yield curve... Read More
ChartWatchers June 04, 2016 at 06:21 PM
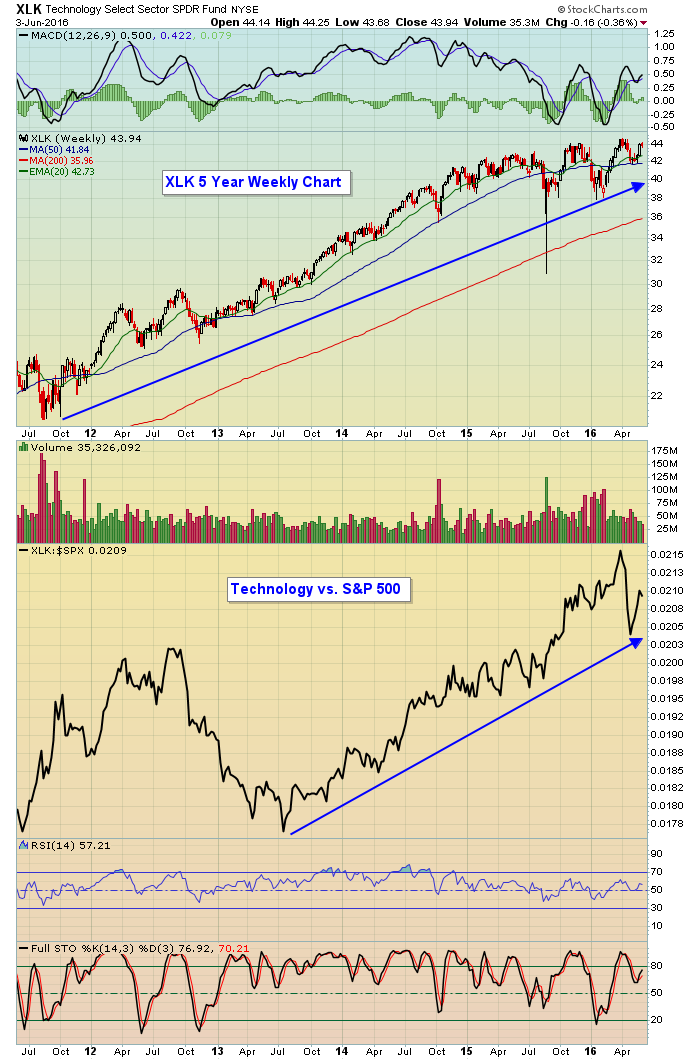
Over the past month, the Dow Jones U.S. Semiconductor Index ($DJUSSC) has risen more than 8% and helped to strengthen the technology sector (XLK) relative to the S&P 500... Read More
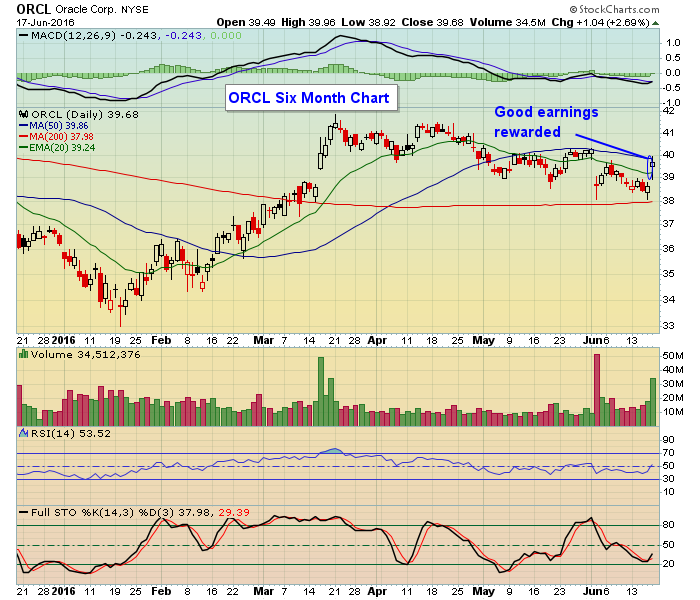
ChartWatchers June 04, 2016 at 04:06 PM
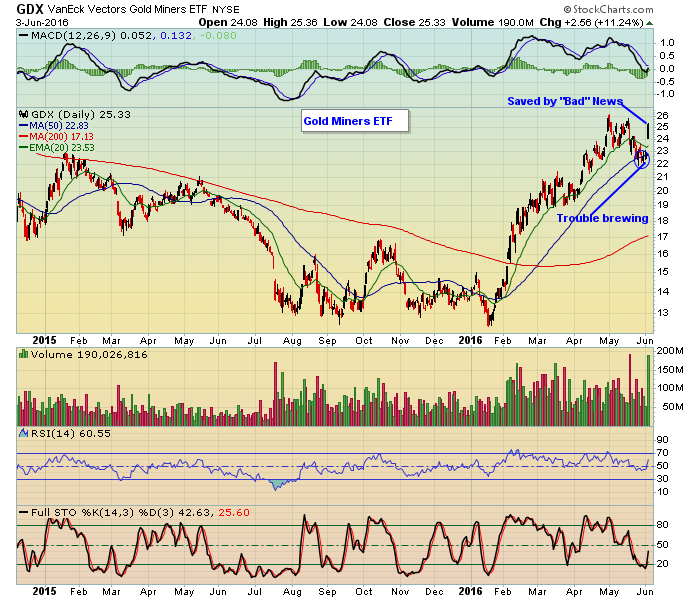
The stock market can be quite mystifying. Depending on the mood of the market, good news can be interpreted as bad news, bad news can be seen as good news and every once in a while good news and bad news are seen just as described... Read More
ChartWatchers June 04, 2016 at 06:10 AM
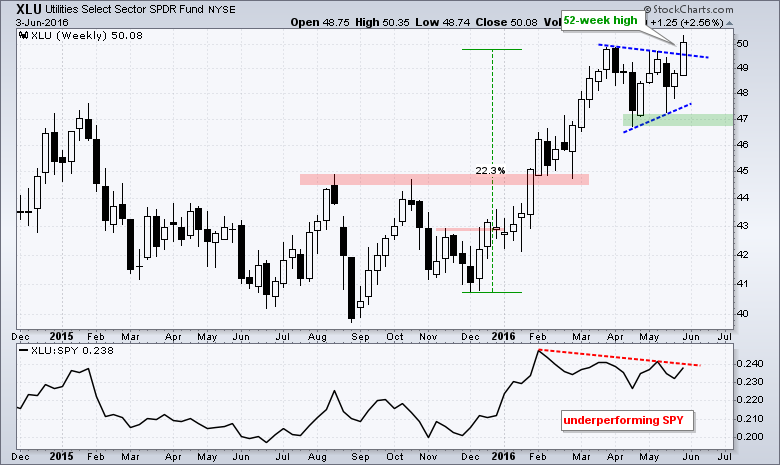
Even though the Utilities SPDR (XLU) has been underperforming SPY since February, it sports the strongest chart of the nine sector SPDRs. How can that be? XLU is the only sector to hit a 52-week high this week. The sector cannot be that weak when it is trading at a 52-week high... Read More
ChartWatchers June 03, 2016 at 09:13 PM
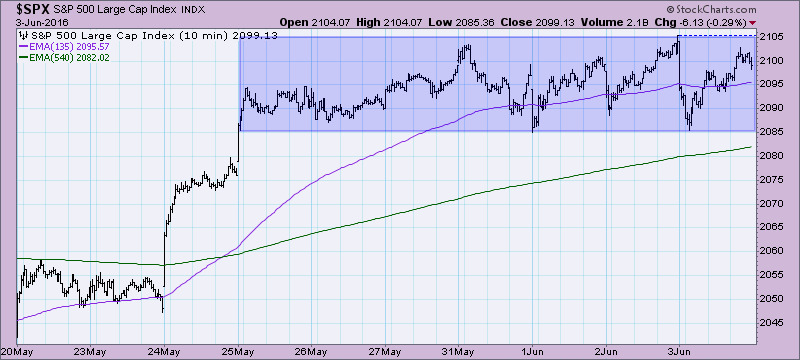
The S&P 500 hit overhead resistance at the April high and has stalled. If you look at the 10-minute bar chart for the past 10 days, you can see that price has been consolidating for over a week and has failed to overcome resistance... Read More
ChartWatchers June 03, 2016 at 09:05 PM
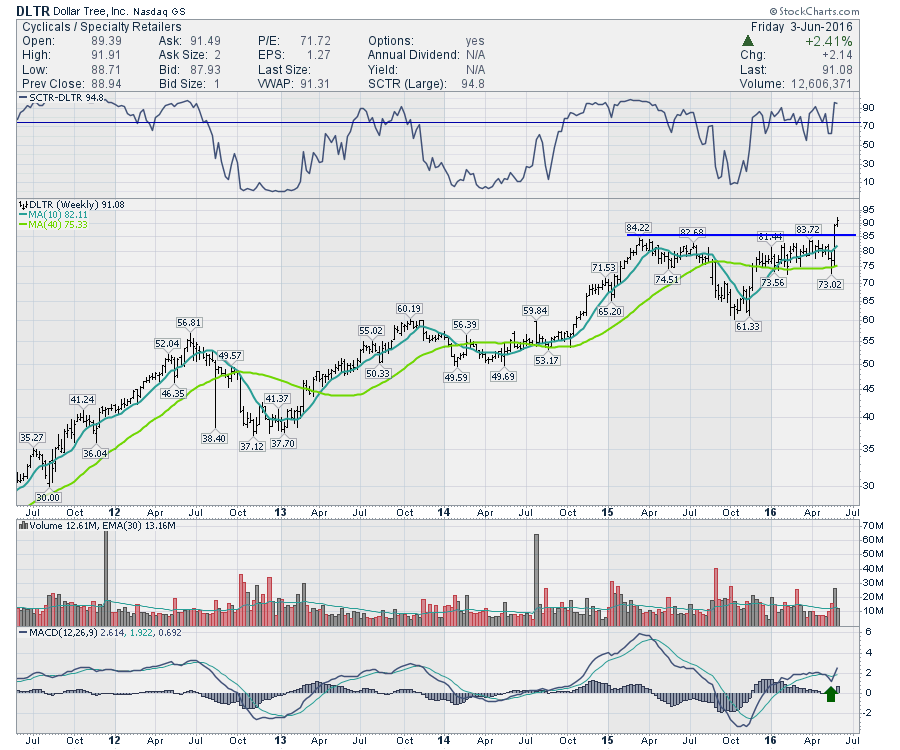
Walmart, Dollar General, and Dollar Tree are all in the top performance rankings currently. Let's look at the charts... Read More