Even though the Utilities SPDR (XLU) has been underperforming SPY since February, it sports the strongest chart of the nine sector SPDRs. How can that be? XLU is the only sector to hit a 52-week high this week. The sector cannot be that weak when it is trading at a 52-week high. The weekly chart below shows XLU breaking out in January and surging over 20%. After becoming a bit overbought in March, the ETF formed a triangle consolidation in April-May and then broke out with a surge last week.
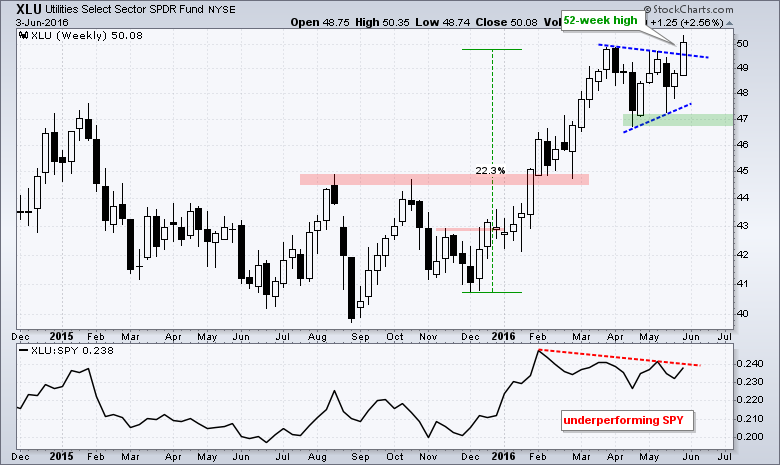
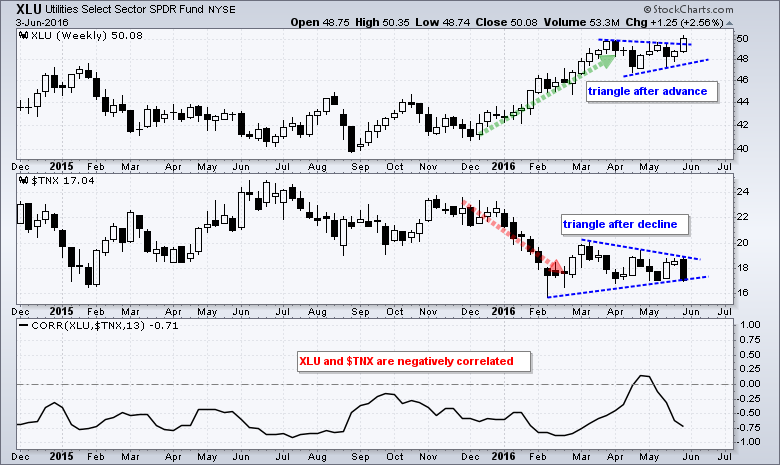
Utilities are benefitting from the plunge in the 10-YR Treasury Yield ($TNX), which was triggered by the big miss on non-farm payrolls. The indicator window shows the Correlation Coefficient (XLU, $TNX). Notice that XLU and $TNX have a strong negative correlation, which means they move in opposite directions. On the chart, the 10-yr Yield fell back below 18 (1.8%) this week as the jobs report missed expectations. Overall, $TNX formed a triangle after a sharp decline and the 10-yr yield is on the verge of breaking the lower trend line. A break would signal further weakness in the 10-yr Yield and this would be positive for XLU.
 ****************************************
Thanks for tuning in and have a good weekend!
--Arthur Hill CMT
Plan your Trade and Trade your Plan
****************************************
