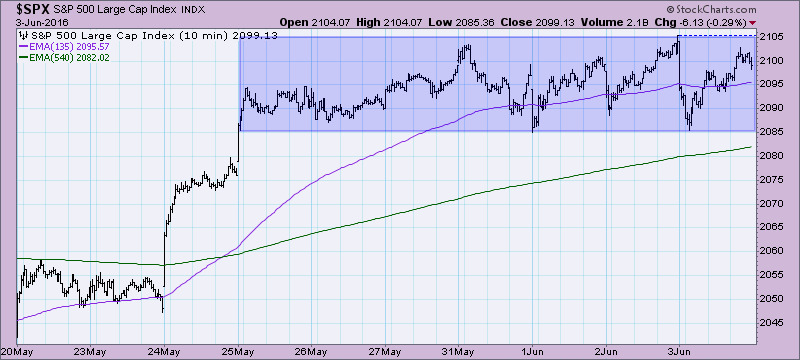
The S&P 500 hit overhead resistance at the April high and has stalled. If you look at the 10-minute bar chart for the past 10 days, you can see that price has been consolidating for over a week and has failed to overcome resistance.
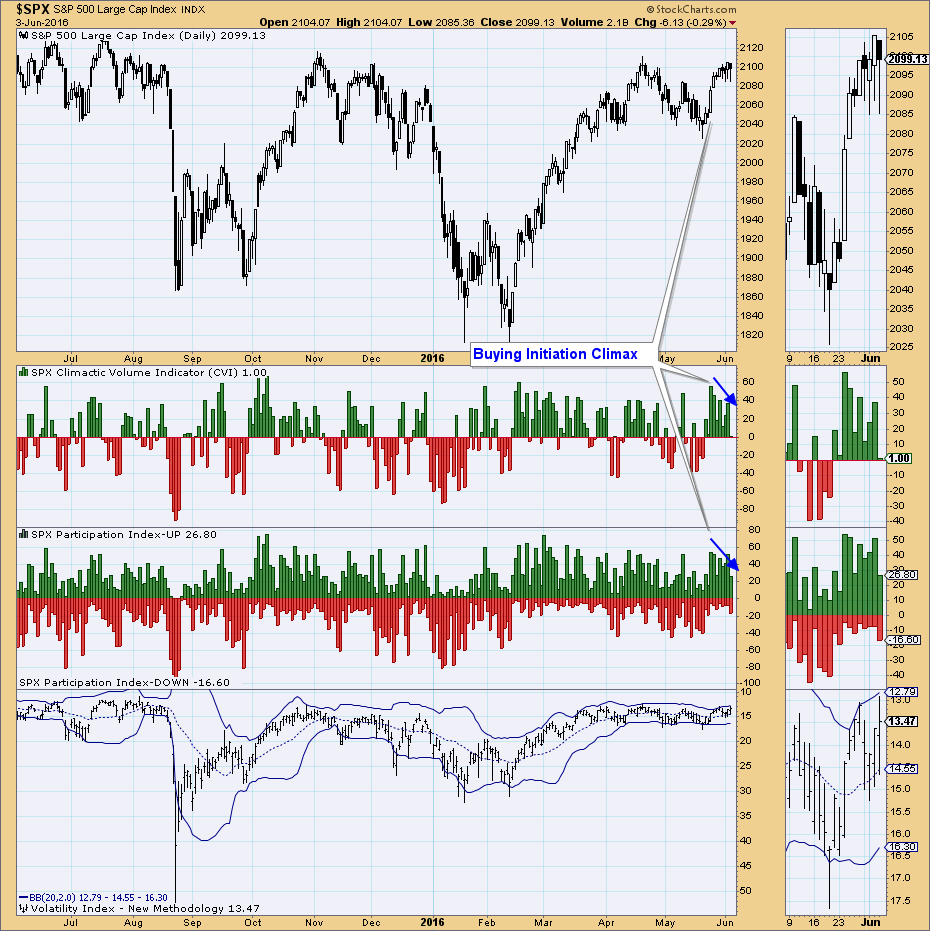
As this consolidation started, our short-term indicators turned bearish. A climactic buying initiation impulse arrived on the ultra-short-term (hours to days timeframe) indicator chart. I define buying initiation impulses as high positive spikes that arrive during a decline. After that, climactic readings continued but they began to trend lower which I consider short-term bearish. Any positive climactic readings that appear would likely be buying exhaustions and any climactic negative spikes would likely be selling initiation impulses.
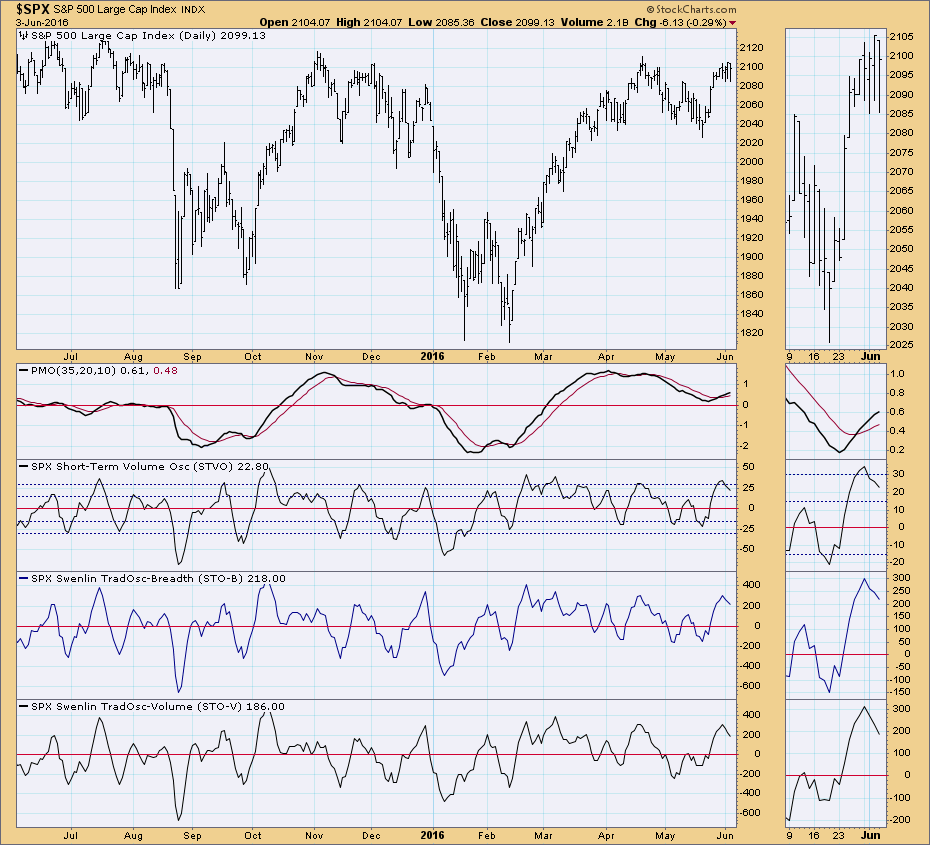
The short-term indicators topped after the initial rally slowed. They are declining bearishly and have not yet left overbought territory. They need to unwind further. This generally occurs one of two ways: 1) decline/pullback, 2) more consolidation.
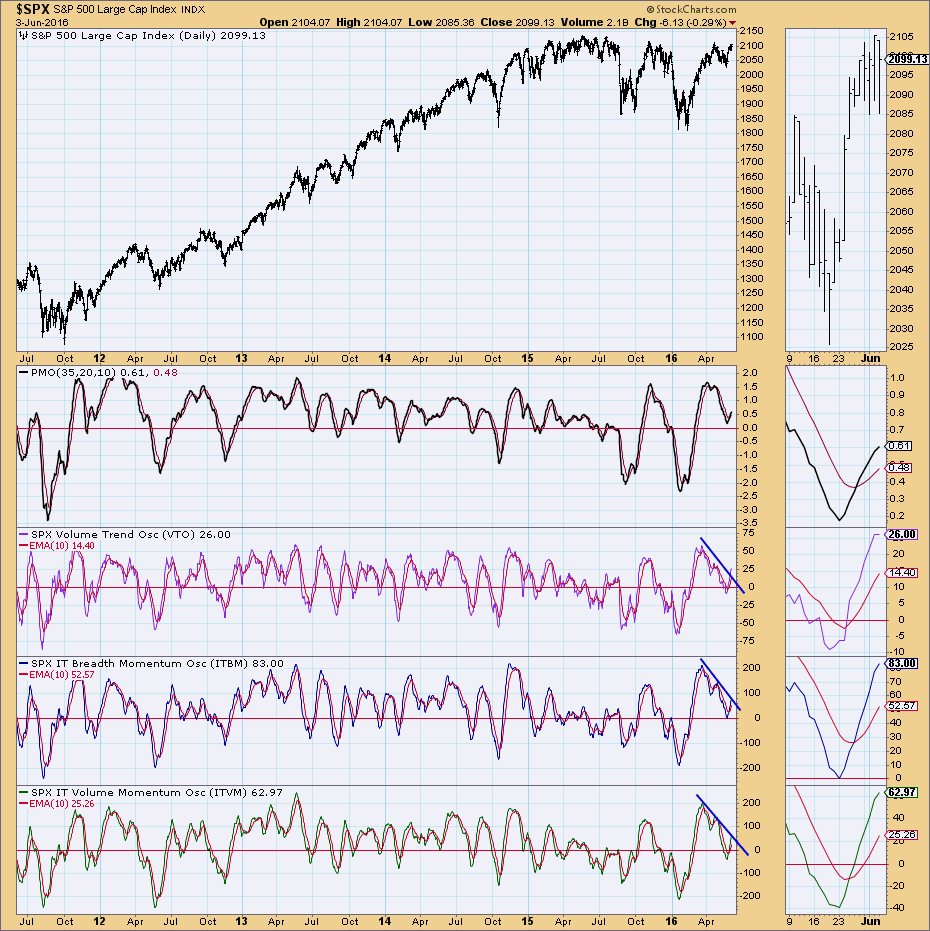
On the other hand, intermediate-term indicators are bullish and rising. The VTO flattened out today, but it has already broken out of its declining trend. The ITBM and ITVM are rising strongly with little hesitation since a positive crossover their EMAs. They haven't quite broken out of their declining trend, but they are poised to next week. Best of all...they aren't overbought.
Conclusion: Short-term indicators are leaning bearish. They need to move out of overbought territory and unwind at least into neutral territory so they can begin storing energy to support a rally to all-time highs as called for by the bullish intermediate-term indicators.
Come check out the DecisionPoint Report with Erin Heim on Wednesdays and Fridays at 7:00p EST, a fast-paced 30-minute review of the current markets mid-week and week-end. The archives and registration links are on the Homepage under “What’s New”.
Technical Analysis is a windsock, not a crystal ball.
Happy Charting!
- Erin
