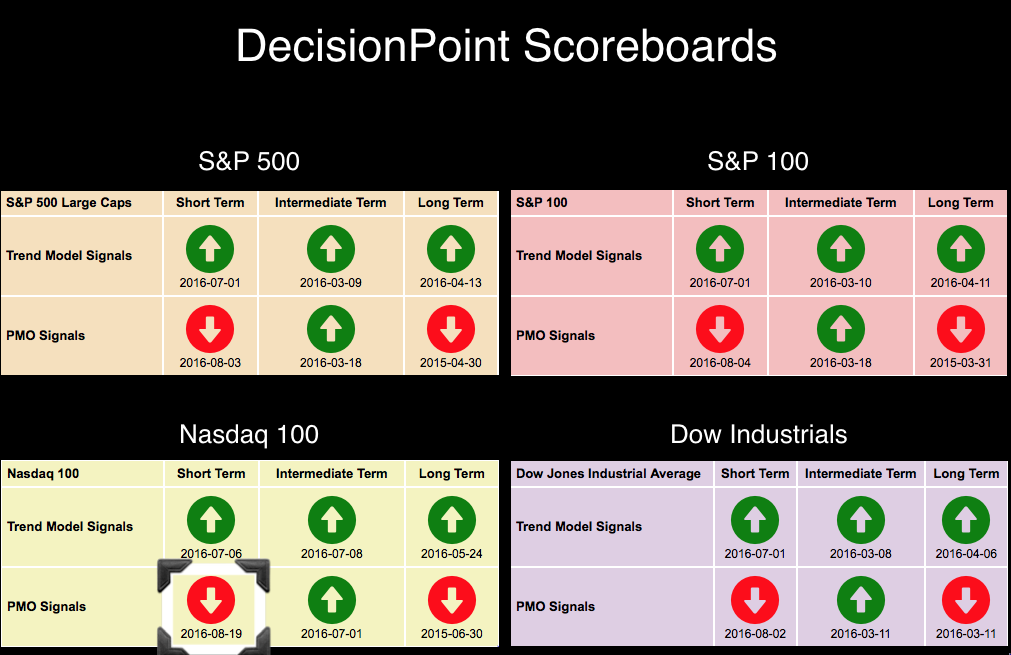
The DecisionPoint Scoreboards have been quiet since the beginning of the month when we saw the OEX, SPX and Dow all switch to short-term Price Momentum Oscillator (PMO) SELL signals. The NDX which has been enjoying a steep rally, has stalled. In so doing, momentum switched negative and hence the new PMO SELL signal.
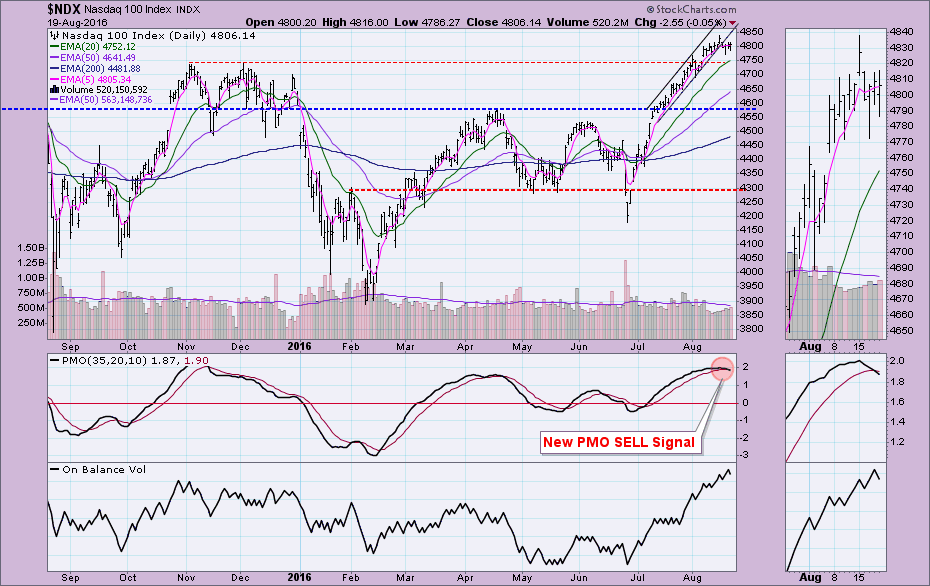
The steep rising trend channel was compromised this week as price drifted slowly outside. I don't consider it a "breakdown" because price did "drift" through the rising bottoms trendline rather than a drop lower. Even though price is consolidating outside the channel, that change in momentum caused the PMO SELL signal to generate. OBV is actually in a positive divergence with price action this past two weeks. As I suggested during my webinar Friday, this divergence could mean that any pullback or decline would find support quickly. Near-term support is along the October/November highs around 4750. A decline to that level wouldn't be devastating. Worst case is a breakdown at that level of support that would indicate a small corrective move to 4575 which also wouldn't be too painful.
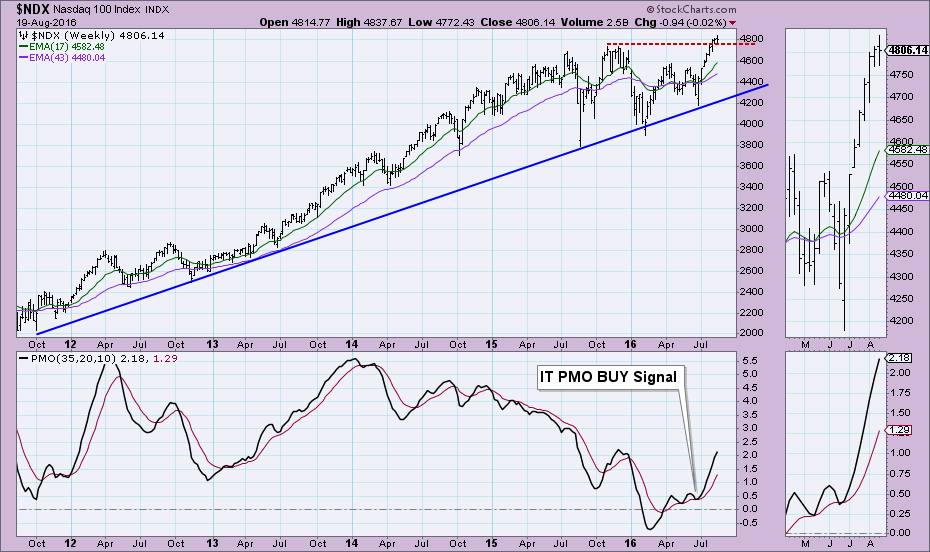
The weekly chart is bullish. We have a strongly rising weekly PMO and the breakout above all-time highs visible. Support is holding.
Conclusion: The NDX triggered a PMO SELL signal after a drift out of a rising trend channel. Support is close and despite a new SELL signal, OBV is in a positive divergence with price, so any decline would likely be stopped by support at either 4750 or 4575.
The NEW DecisionPoint LIVE public ChartList has launched! Click on the link and you'll find webinar charts annotated just before the program. Additional "chart spotlights" will be included at the top of the list. Be sure and bookmark it!
Come check out the DecisionPoint Report with Erin Heim on Wednesdays and Fridays at 7:00p EST, a fast-paced 30-minute review of the current markets mid-week and week-end. The archives and registration links are on the Homepage under “Webinars”.
Technical Analysis is a windsock, not a crystal ball.
Happy Charting!
- Erin
