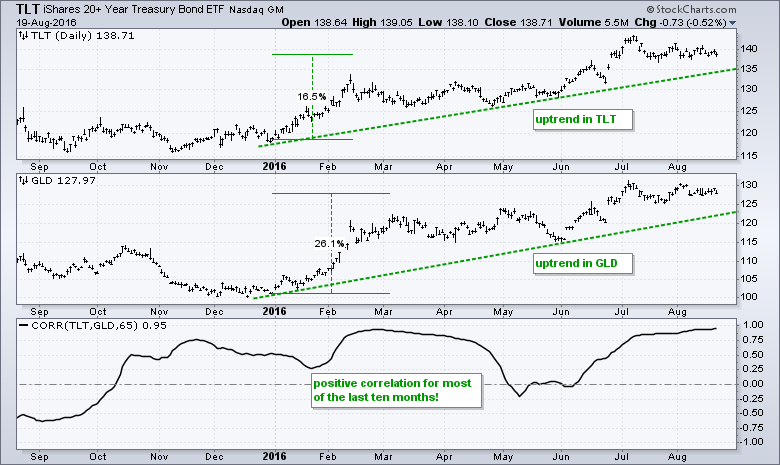
The Gold SPDR (GLD) and the 20+ YR T-Bond ETF (TLT) are two of the best performing asset class ETFs this year and both remain in clear uptrends. GLD is up over 26% year-to-date and TLT is up around 16%. One would not expect bonds and gold to be leading at the same time. The indicator window shows the 65-day Correlation Coefficient (GLD,TLT) to confirm the positive relationship. Notice that gold and bonds have been positively correlated for most of the last ten months (since mid October). A positive correlation means they have tended to move in the same direction. It is strange to see this positive correlation, but it is what it is and this is a good time for the prayer of serenity.
In addition to a strong positive correlation, GLD and TLT have the same chart setups working. Let's start with GLD. The chart shows price bars over the last eight months with Bollinger Bands in pink the BandWidth in the indicator window. The bands narrow and BandWidth falls when volatility contracts. Conversely, the bands widen and BandWidth rises when volatility expands. John Bollinger, creator of Bollinger Bands theorized that a volatility expansion follows a volatility contraction so we should prepare for a move. Bollinger Bands, however, do not provide any directional clues. Chartists need to rely on the price chart, patterns and indicators for that.
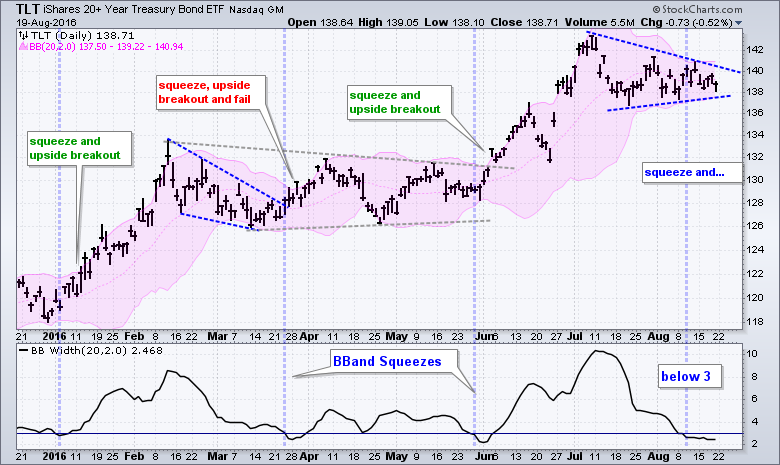
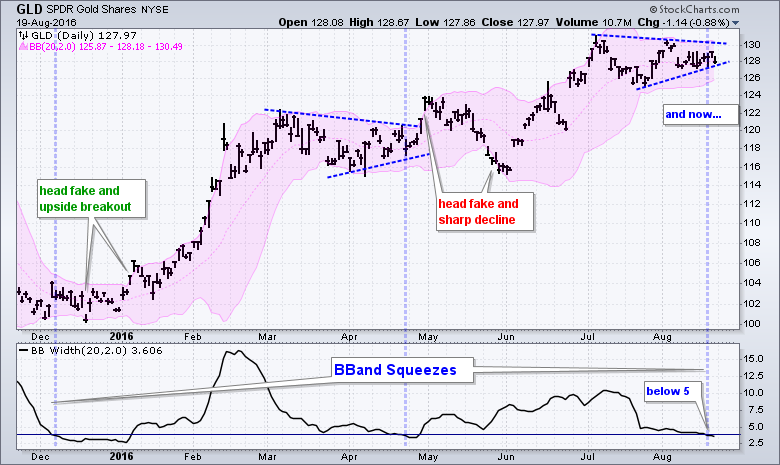 On the chart above, GLD is forming a triangle within a bigger uptrend as BandWidth dips below 5 for the third time this year. Triangles are typically continuation patterns and this favors an upside breakout. The Bollinger Bands narrowed in December and April (blue dotted lines), but the initial breakouts did not hold and whipsaws ensued. GLD broke the lower band for a signal in mid December, but this turned out to be a head fake as GLD promptly surged above the upper band in early January. Bollinger warned of the head fake in his book, Bollinger on Bollinger Bands. A head fake also occurred in late April as the upside breakout failed to hold. We can never predict a head fake, but must be prepared for a whipsaw. I am currently watching the narrowing bands for the first signal. A break above the upper band would be bullish and a break below the lower band bearish. The next chart shows TLT with a similar squeeze and similar setup.
 ****************************************
Thanks for tuning in and have a good weekend!
--Arthur Hill CMT
Plan your Trade and Trade your Plan
*****************************************
