Hello Fellow ChartWatchers!
Where is everybody? Things look pretty darn good on the weekly index charts:
- Stocks are at or near new all-time highs.
- The Tech sector is showing signs of life.
- Energy stocks are roaring up the SCTR rankings
- The "New Highs-New Lows Line" is moving higher (and still has room to grow)
- Lots of well-known stocks are in well-established uptrends
- Etc., etc., etc.
So why is weekly volume so, so, so... anemic? New Highs are usually greeted with volume spikes. Last week it was like all the stock traders have been kidnapped! So what's it gonna take for people to get interested in stocks again? Well... Maybe all it takes is to get out of August. To see why I say that, let's use our Seasonality Tool with volume data and dig deeper into this mystery.
Our Seasonality Tool shows you - for each month of the year - how a given ticker symbol's values have changed during that month for the previous "n" years (where "n" is a number you control via an interactive slider under the chart). So, for example, if a stock does well every November (probably in preparation for Christmas buying), the November bar on the Seasonality tool would be taller than the other months.
There's an old investing adage that you've probably heard before: "Sell in May and then go away." (Presumably until September/October.) The idea is to avoid the months where stocks typically move lower and focus on the period of time (October thru April) when stocks often do well. The adage raises two questions:
- Do stocks really underperform during the spring and summer months?
- Do investors really avoid the stock market during those months?
Our Seasonality tool can help answer both of those questions easily. First, let's look at the month-by-month performance of the S&P 500 Large-Cap Index ($SPX):
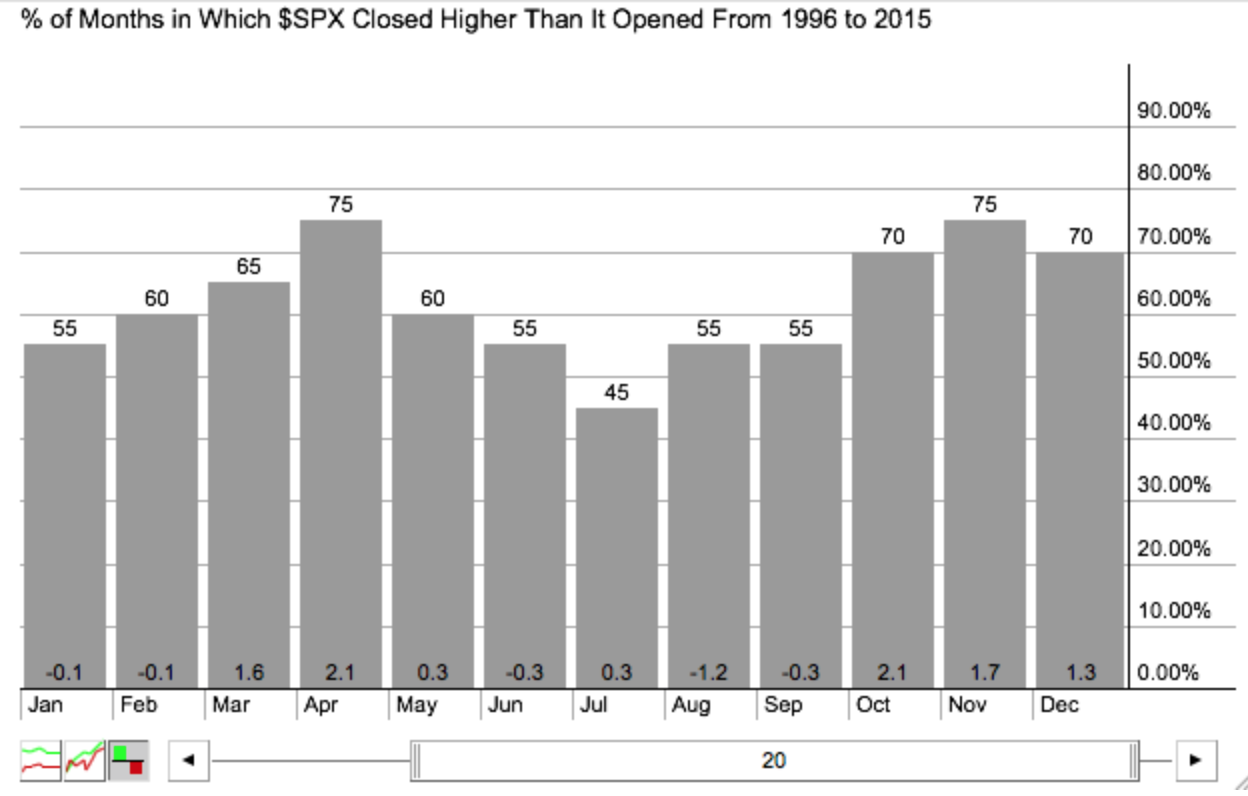
This charts says that during the 20 years from 1996 to 2015, 75% of the time the S&P 500 closed the month of April (for example) higher than it started with an average gain of 2.1% (the number at the bottom of April's histogram bar).
So, clearly, the months of April, October, November and December are historically great months for the S&P. During those months the market rises 70+ percent of the time. And the average amounts for those rises is also nice: 2.1%, 2.1%, 1.7% and 1.3%.
But when it comes to the summer months, this chart paints a mixed picture. Clearly, July is the weakest month rising only 45% of the time. But notice that July still averages a 0.3% gain. So does May. The other months are not great and, yes, August is by far the worst month of the year for stocks averaging a 1.2% loss historically even though it manages to rise more than half the time.
OK, so stocks can be considered to be weaker during the summer months. Now, let's focus on the second question: Do investors really avoid the stock market during those months? Here's the month-by-month seasonality chart for the NYSE Total Volume ($NYTV) index:
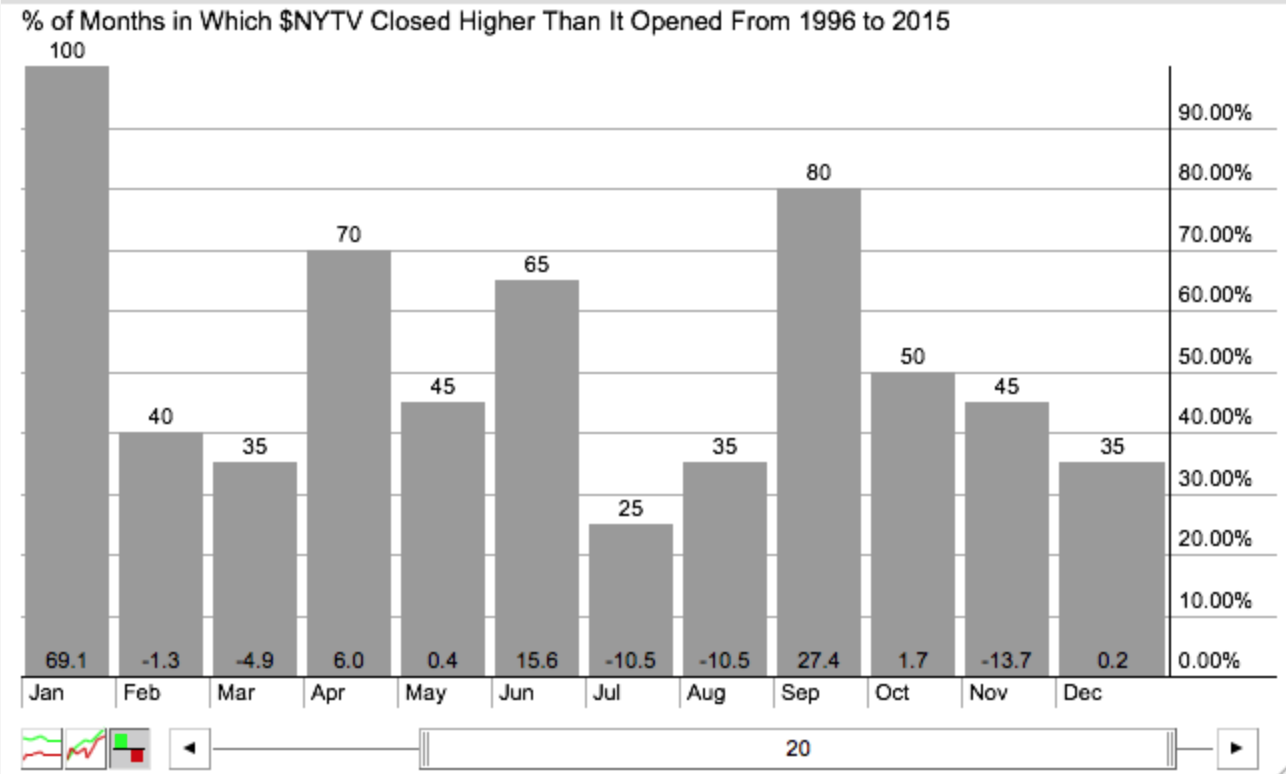 Hmmm... This chart shows that volume on the last day of the month is (on average) 10.5% less than it was on the first day of the month for both July and August and that volume decreases during those two months 75% and 65% of the time. Only November has a bigger drop (13.7%) - probably due to the holiday week at the end of that month.
So my conclusion is that investors typically do "stay away" in August regardless of what the market is doing. I guess it is something that is programmed into their DNA. The good news is that - as technicians - we are able to take advantage of this situation. We are able to recognize a rally regardless of when or why it is happening and use strong technical signals (coupled with strong risk management skills) to take advantage of these opportunities.
Bottom Line: Now is NOT the time to be ignoring the market, even if everyone else is. While I'd love to see strong volume back up these new highs, they are still new highs nonetheless and that's a wonderful thing.
- Chip
