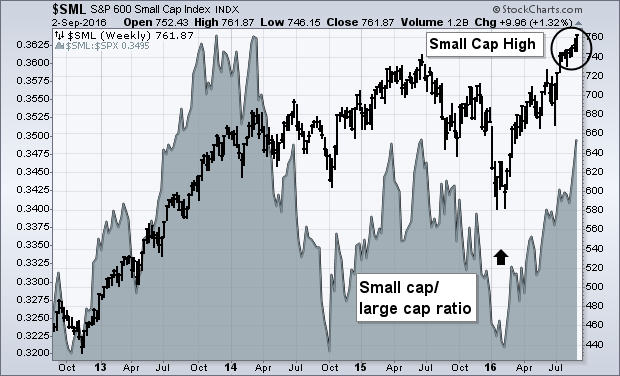
While most of the media focus is on sideways action in large cap stocks, smaller stocks have been rising. The weekly bars in Chart 1 show the S&P 600 Small Cap Index ($SML) ending the week at a new record high. The solid matter is a relative strength ratio of the SML divided by the S&P 500. It shows smaller stocks leading large caps higher since the February bottom. Smallcaps had been market laggards since the middle of 2014. Their relative strength ratio is close to a two-year high. That's a positive sign for them and rest of the market. Small cap leadership is a sign that investors are more optimistic on the economy and willing to assume more risk. The Russell 2000 Small Cap Index ($RUT) has yet to achieve a new high. I've pointed out in the past, however, that the SML has a history of leading the RUT higher.
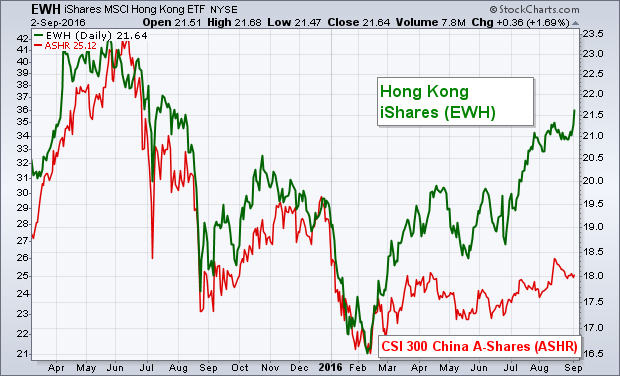
 Emerging markets ended the week on a strong note. I keep reading that Chinese stocks have not participated in the EM rally. That may be true in Shanghai, but not in Hong Kong. The green line in Chart 2 shows Hong Kong iShares (EWH) ending the week at the highest level in two years. I recently suggested that a more stable Hong Kong dollar was attracting money (versus mainland stocks that are denominated in Chinese yuan). A more international audience and better liquidity is another factor. So is the fact that Hong Kong stocks yield more than 3.5% which makes them attractive for yield-chasing investors. I believe it's just a matter of time before mainland Chinese stocks start rising as well. The red line plots the CSI 300 China A-Shares ETF (ASHR) which just recently hit an eight-month high. Rising Chinese shares would also be good for emerging markets in general.