The Dow has shattered records, small- and mid-caps are doing the same. Those that have not yet reached record highs are still participating, preparing to break above all-time highs. Indicators for some time have been leaning bearish, but in the past week DecisionPoint indicators in the intermediate term have a new decidedly bullish bias.
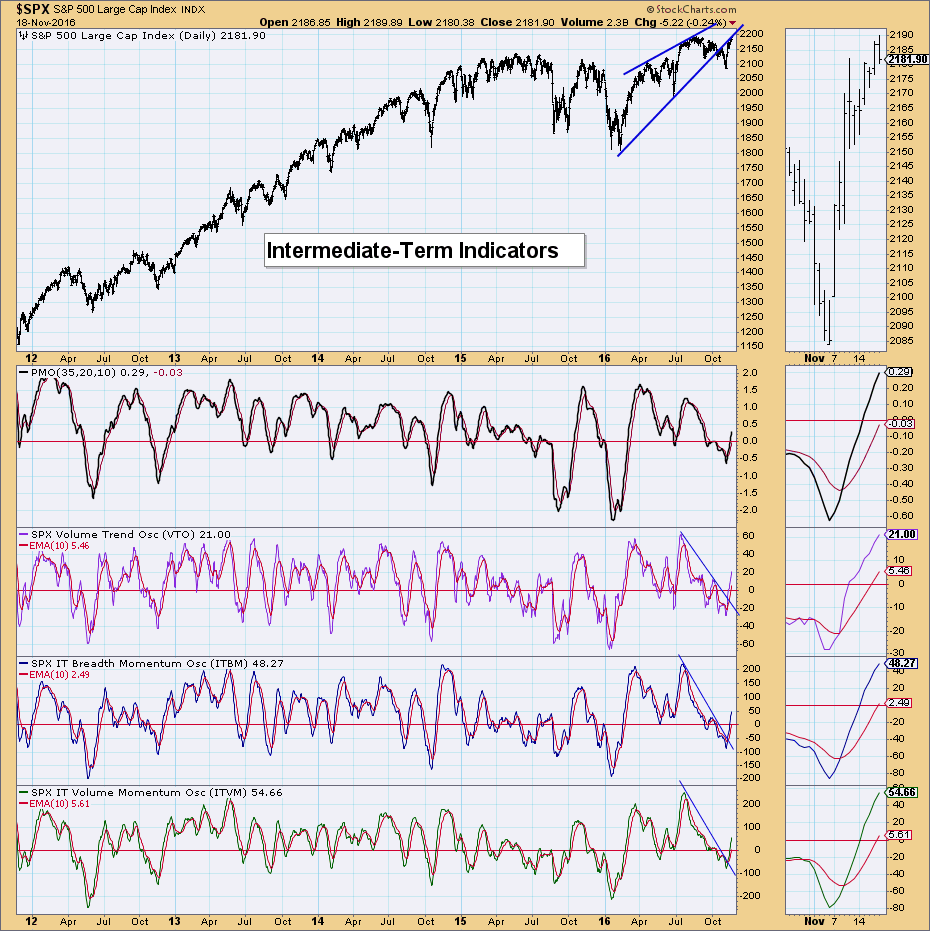
First, here's a look at the intermediate-term indicator chart I discussed during today's webinar and found in the DP Shared ChartList. We see that the rising wedge executed and price is now pushing up against the rising bottoms line. These are my 'go to' intermediate-term indicators. They are very good at warning of a change in the weather, just like a windsock. They had been in a declining trend since all-time highs were set. They had already begun to rise, but the post-election rally continuation finally shook them from their declining trend. They are quite bullish as they rise strongly and without much hesitation.
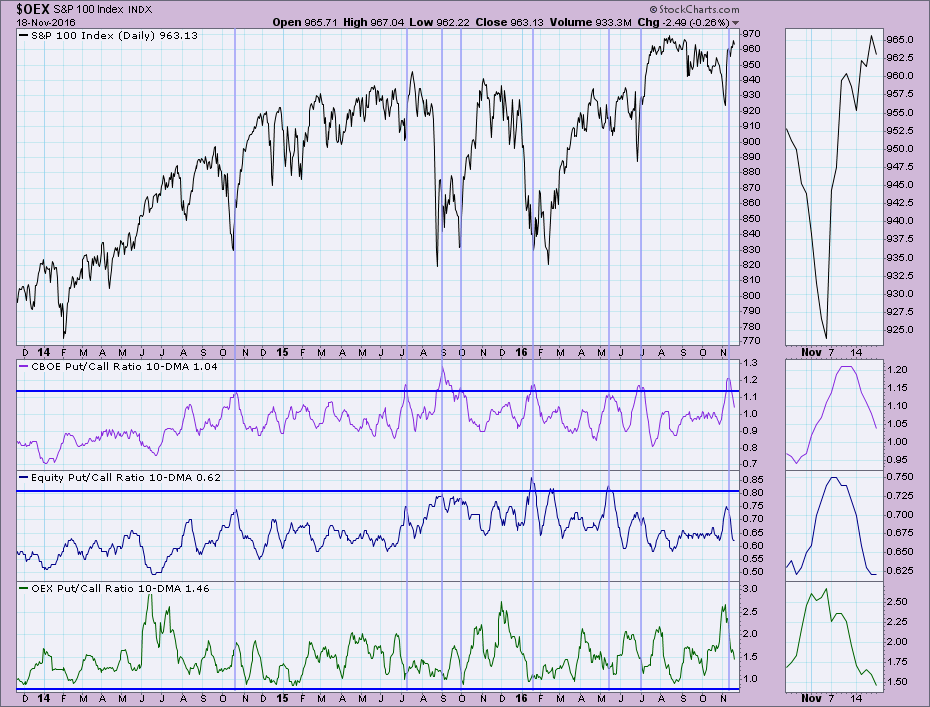
The Put/Call Ratio is a sentiment indicator, meaning that it is contrarian. A reading higher than 1.0 indicates there are more puts than calls which means the market is feeling short-term bearish. These ratios reached the top of their bearish ranges and are now falling, essentially confirming the current rally. There is plenty of room for these indicators to fall before being considered bearish.
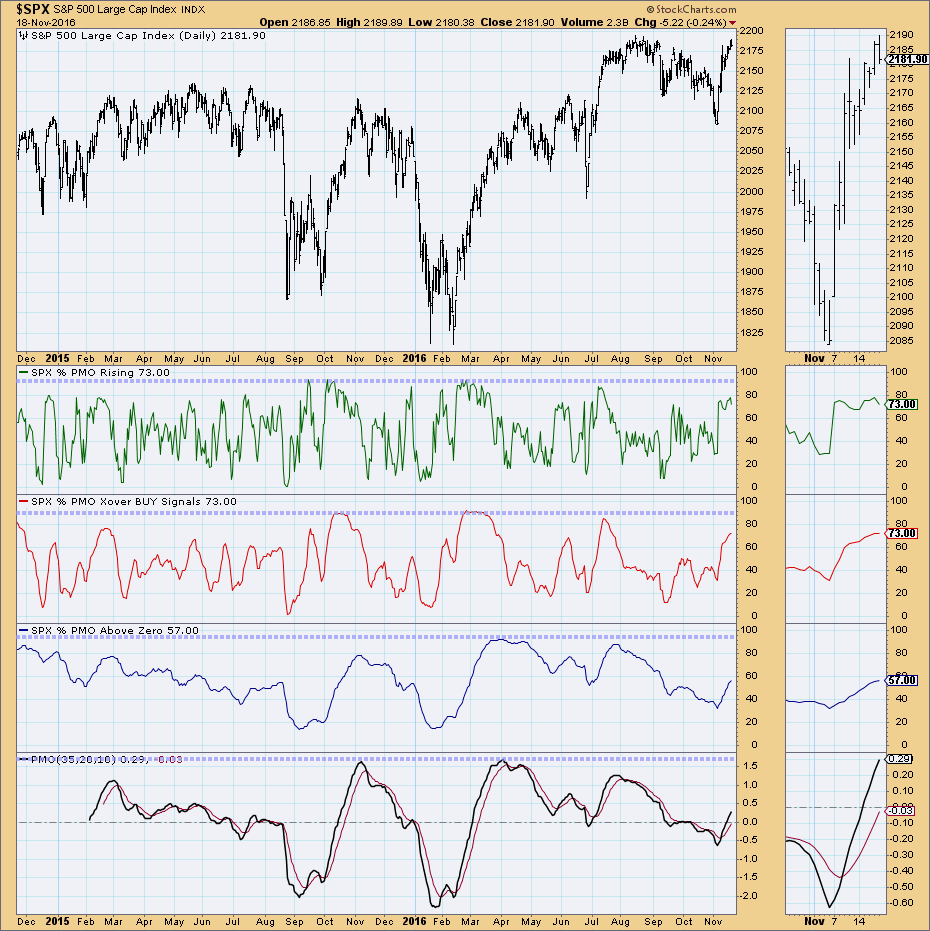
The Price Momentum Oscillator (PMO) Analysis chart is broken up into three main windows, each in its own timeframe. The first window is %PMO Rising. It isn't really overbought but it is beginning to fall. I think this supports the idea of a throwback to breakout points before we see more rally. The %PMO Crossover BUY Signals is an intermediate-term indicator. It is rising but has not yet reached overbought territory which is bullish. Additionally, you can see that once it does reach the top of its normal range and a bull market rally is sustained, they can remain at the top of their range. The %PMO Above Zero is a long-term indicator. It is rising bullishly and definitely has plenty of room to move higher before becoming overbought.
Conclusion: Intermediate-term indicators are bullish and suggest a rally continuation. If you read the DP Alert or attend my webinars, you'll know that short-term indicators are bearish right now. Nervous profit-taking could fuel a short-term decline which might be enough enticement for buyers who missed this rally to take advantage and run prices back up.
The NEW DecisionPoint LIVE public ChartList has launched! Click on the link and you'll find webinar charts annotated just before the program. Additional "chart spotlights" will be included at the top of the list. Be sure and bookmark it!
Come check out the DecisionPoint Report with Erin Heim on Wednesdays and Fridays at 7:00p EST, a fast-paced 30-minute review of the current markets mid-week and week-end. The archives and registration links are on the Homepage under “Webinars”.
Technical Analysis is a windsock, not a crystal ball.
Happy Charting!
- Erin
