ChartWatchers December 17, 2016 at 04:18 PM
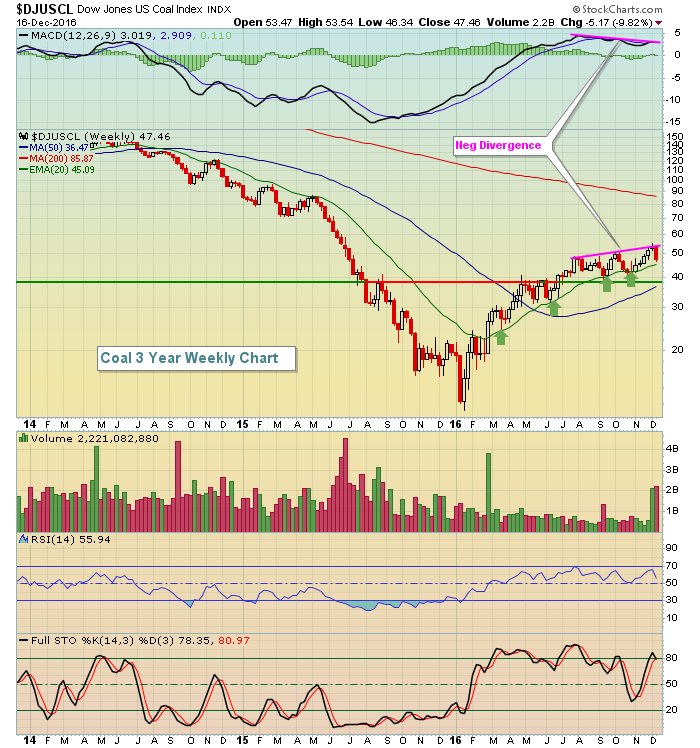
We're two weeks away from another stock market year in the books. Where does the time go? Anyhow, since this is the last ChartWatchers newsletter of 2016, it would be an appropriate time to check out the best and worst industry group awards for 2016... Read More
ChartWatchers December 17, 2016 at 02:14 PM
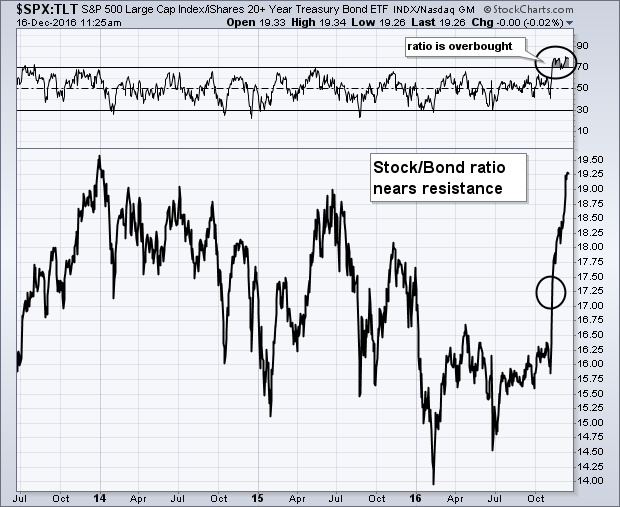
Several market messages over the past couple of months used relative strength ratios to paint a more bullish picture of the stock market, and a more bearish picture for bonds... Read More
ChartWatchers December 17, 2016 at 06:03 AM
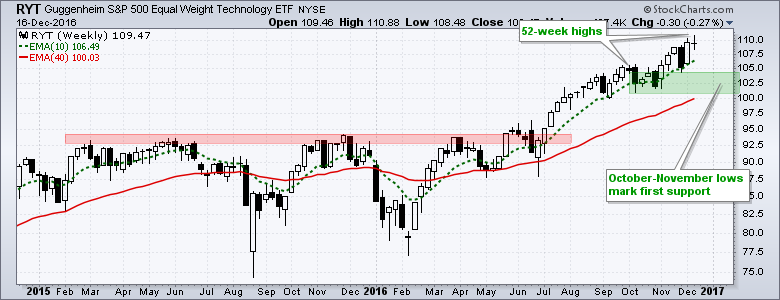
Even though the finance, energy and industrials sectors are grabbing most of the headlines these days, the tech sector is doing just fine with the Nasdaq 100 ETF (QQQ), the Nasdaq 100 EW ETF (QQEW), the Technology SPDR (XLK) and the EW Technology ETF (RYT) hitting new highs this ... Read More
ChartWatchers December 16, 2016 at 09:57 PM
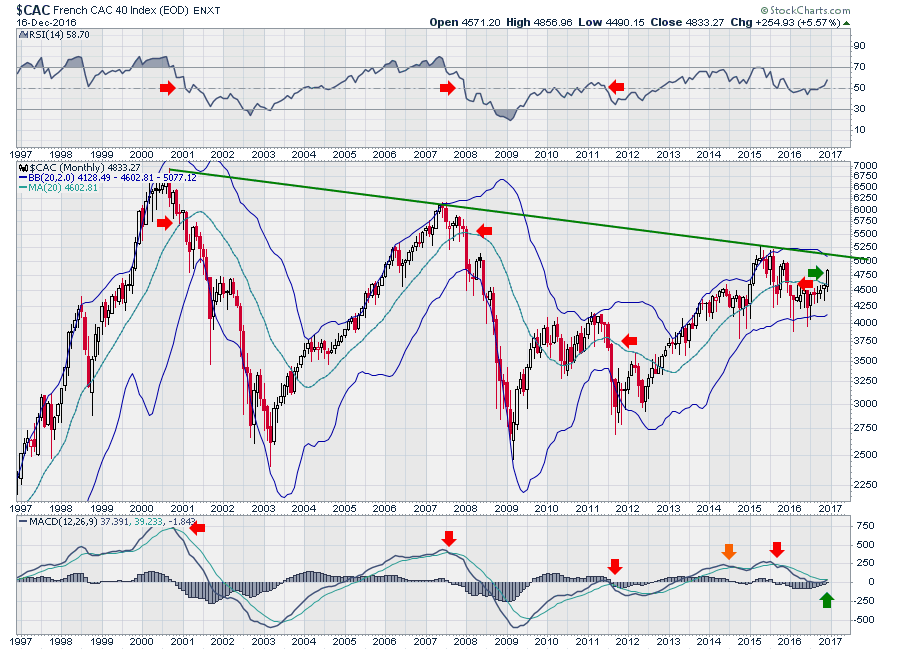
There are some very important macro charts starting to come into play globally. These are monthly charts, so we need to check these at the end of December, January and February. The collection of charts shows how big a global bull market could be if they all break through... Read More
ChartWatchers December 16, 2016 at 08:24 PM
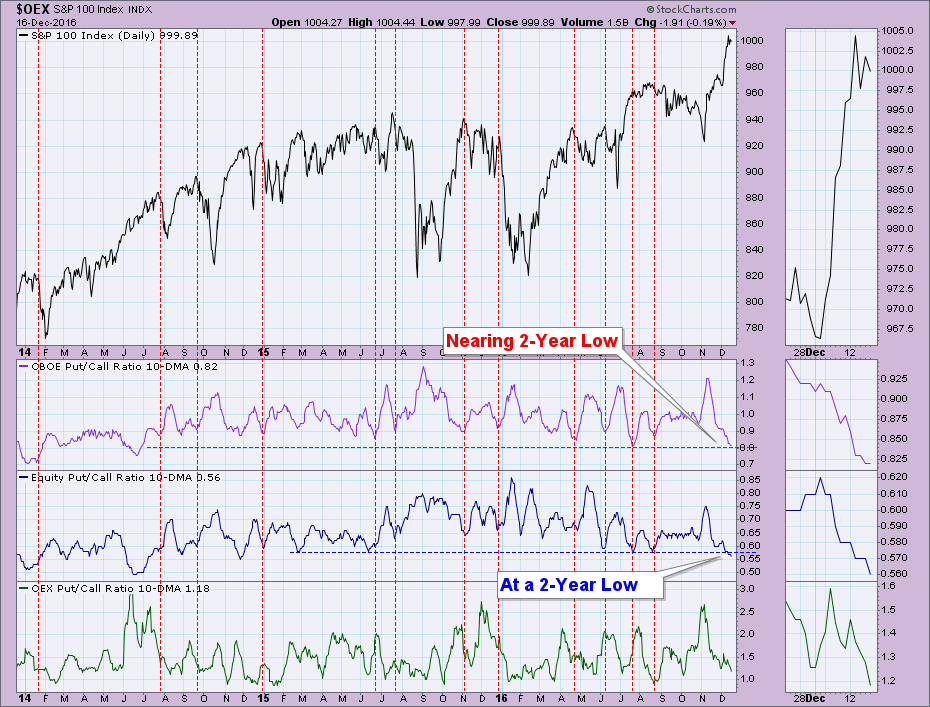
A webinar viewer recently sent me a chart showing put/call ratios nearing extreme lows. I pulled up the chart and indeed, the 10-DMA of the put/call ratios are nearing or are at two-year lows... Read More
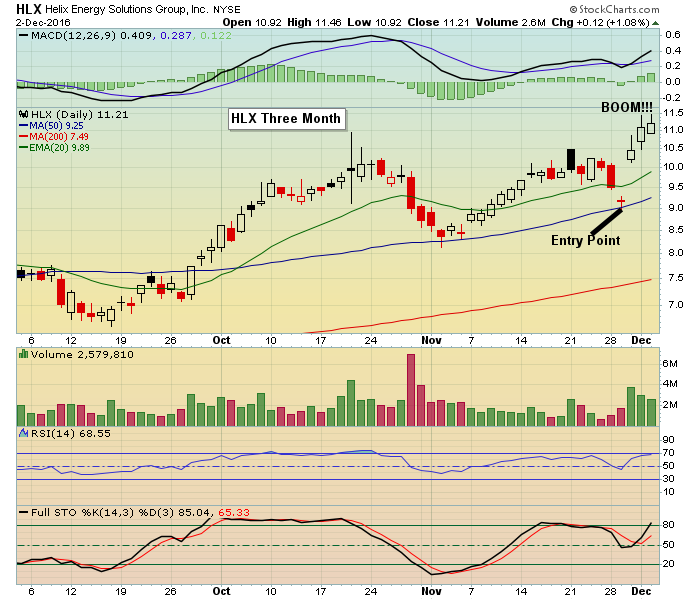
ChartWatchers December 03, 2016 at 01:54 PM
I spend a great deal of time scouring the market and looking for interesting trade setups. It's quite often that I see a stock that I really like, but it's not at a price level where I'm ready to pull the trigger... Read More
ChartWatchers December 03, 2016 at 12:19 PM
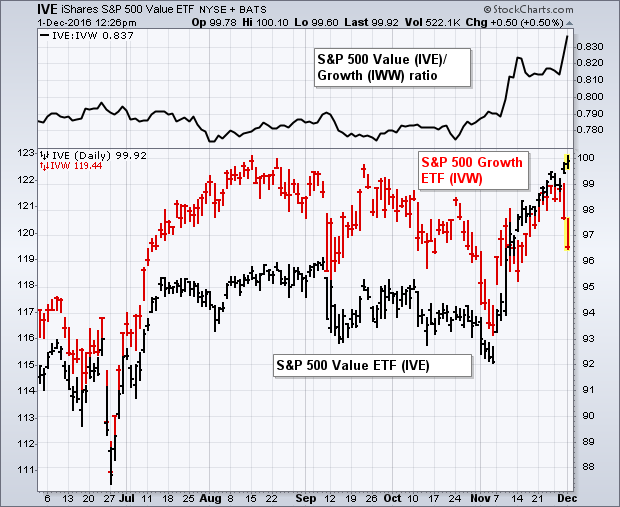
Two days after the election (November 10), I wrote a message entitled: "Rotation Out of Growth Stocks into Value Stocks Causes Profit-taking in Technology"... Read More
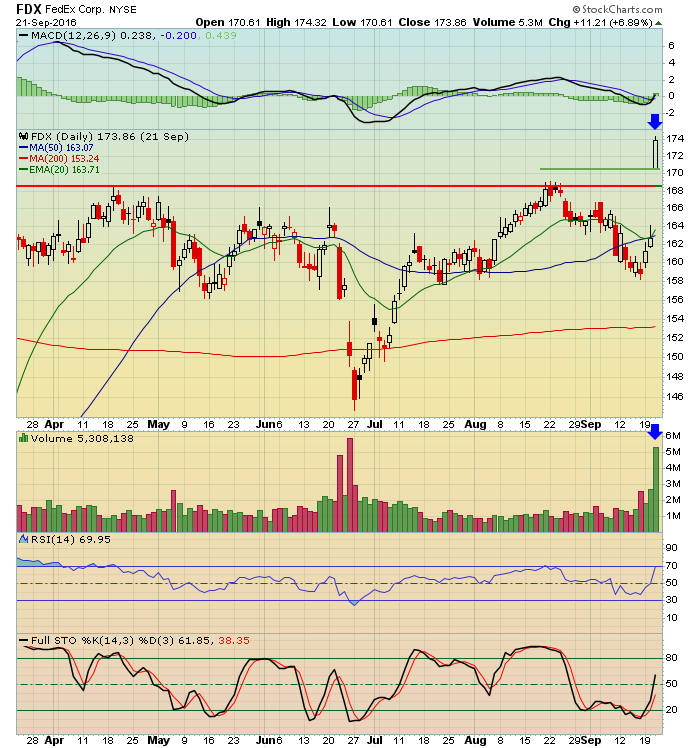
ChartWatchers December 03, 2016 at 12:01 PM
Every once in a while the gods of trading look out for us and reward our perseverance, a little bone for all of those trades that don't turn out so well... Read More
ChartWatchers December 03, 2016 at 03:41 AM
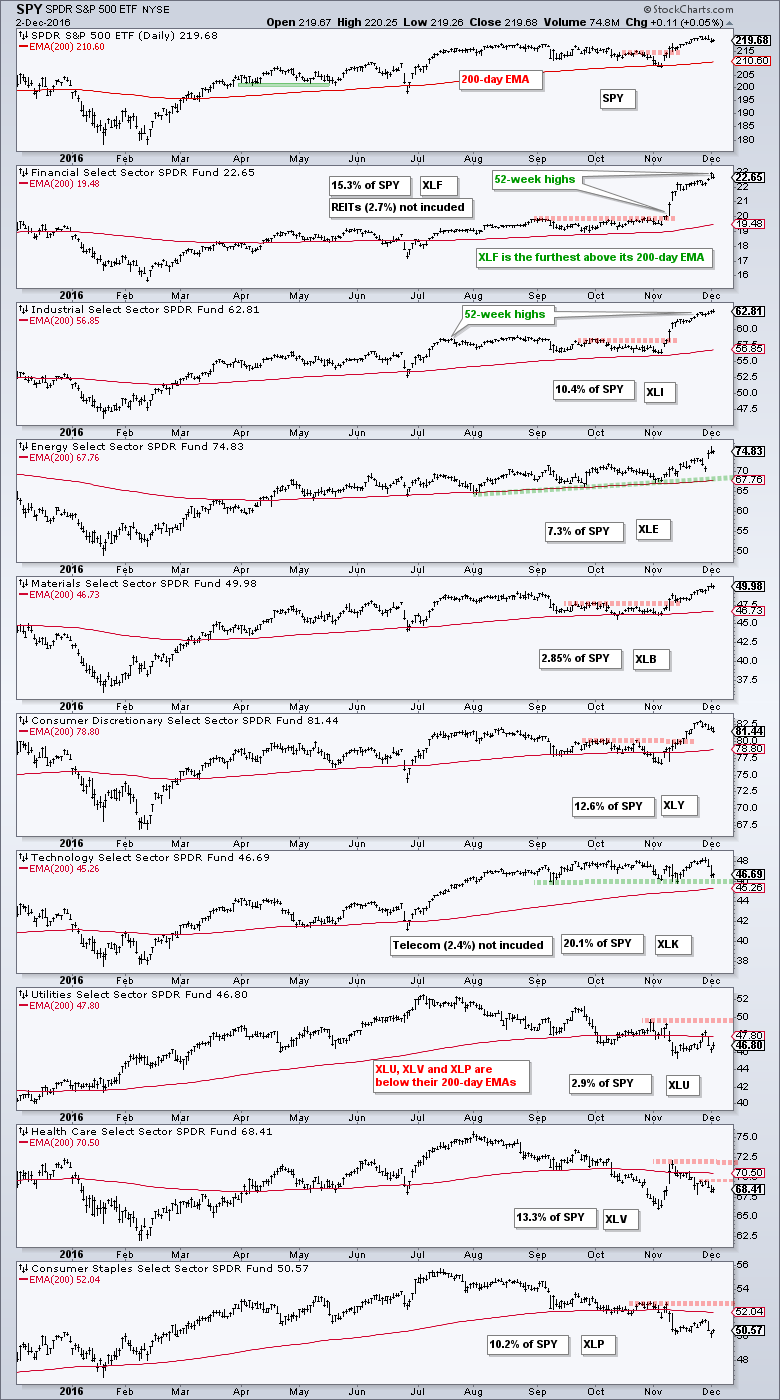
The whole is only as strong as the sum of its parts. Applying this logic to the stock market, the S&P 500 represents the whole and the nine sector SPDRs represent the sum of the parts. Let's see just how strong the parts of the S&P 500 are... Read More
ChartWatchers December 02, 2016 at 11:23 PM
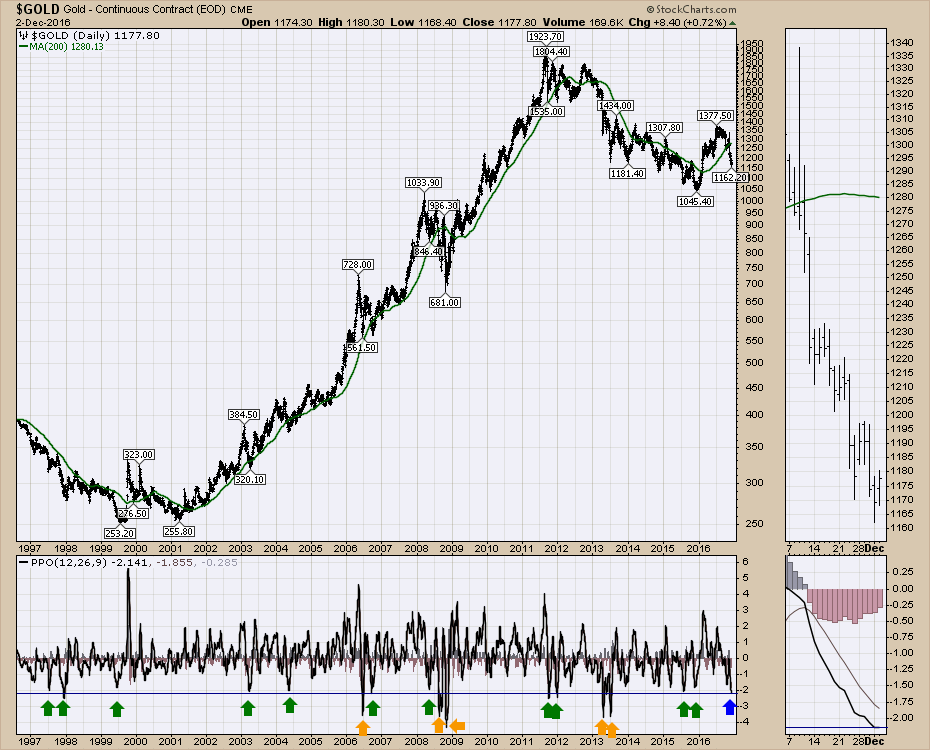
Gold has dropped into the very unloved category. There is a great quote that interests me when we get technical setups like this. " I believe the very best money is made at market turns... Read More
ChartWatchers December 02, 2016 at 09:25 PM

The daily chart of the Nasdaq 100 doesn't really resemble any of the other large-cap indexes or even most small-cap indexes. Technology sectors have performed terribly. The Election "euphoria" enjoyed by the Dow Industrials and most other indexes really didn't do much for tech... Read More