There are some very important macro charts starting to come into play globally. These are monthly charts, so we need to check these at the end of December, January and February. The collection of charts shows how big a global bull market could be if they all break through.
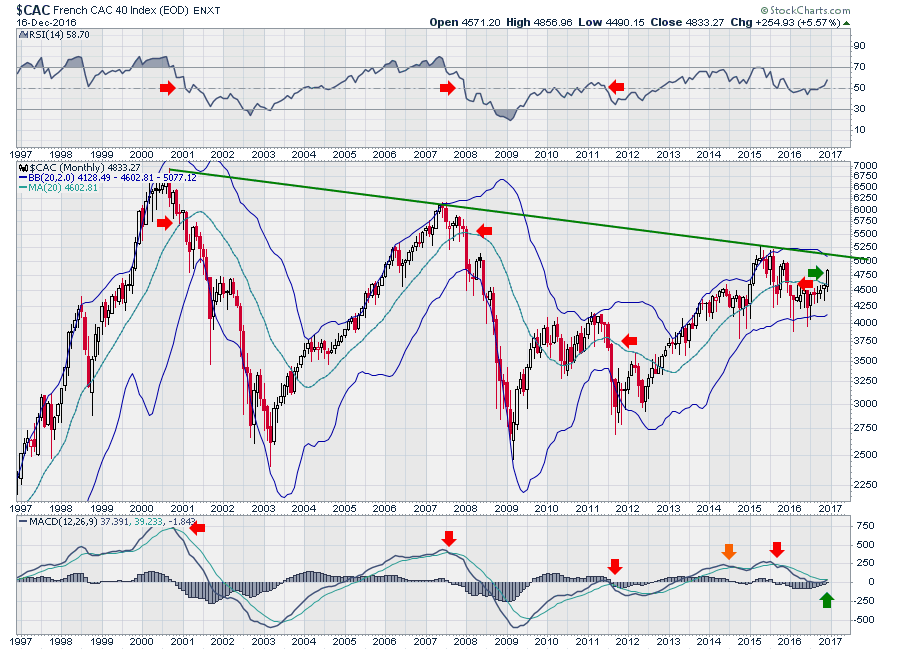
First of all, France looks like it wants to test the 16-year, long term trend.
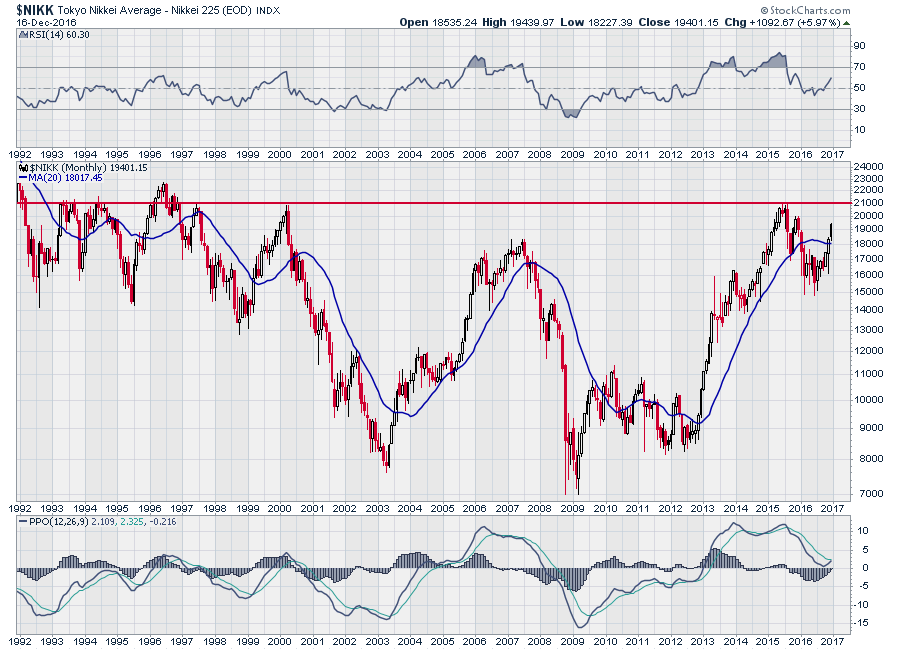
This chart for the Nikkei in Japan always shocks me when I zoom out. Notice how important 21000 has been for the Japanese Market for the last 25 years, yes 25 years! There is a trend of higher highs and higher lows.
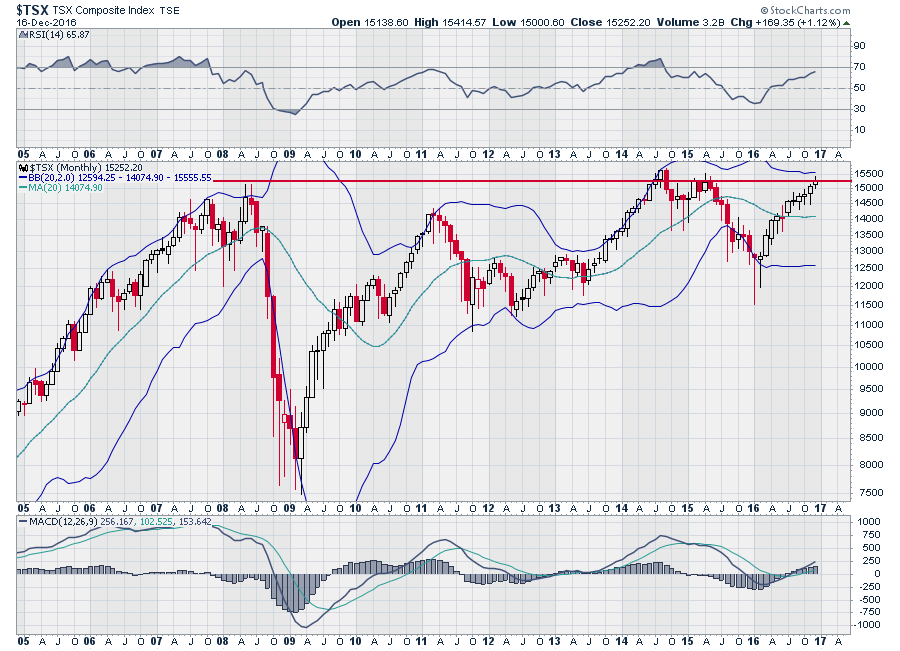
 Lastly, Canada is also trying to break through a 10-year top.
For 2017, there seems to be massive optimism. As all of these charts test these trend lines over the coming months, we'll have a better feel if we are in a new global bull market. If they break through, this will be fantastic. If they stall around these levels again, it will be very important to suggest there is not enough global enthusiasm.
I have been blogging heavily about Commodities lately and hopefully most of you missed the downdraft in Gold. Here is my most recent article on the Commodities Countdown blog. The Markets Need To Absorb The Rising US Dollar. You'll also find a link in the blog to the Commodities Countdown webinar which covers off the big move in the US Dollar.
The Canadian market has also been soaring. The Canadian Technician Blog has a new article on some Canadian sectors and a link to the Canadian Technician Webinar. Canadian Stocks Wiggle Uncomfortably. I discussed four important charts in Canada that all broke trend lines this week.
In case you missed the Don't Ignore This Chart blog, it had some great articles this week from a variety of authors.
You can always catch my one-liners and one-Charters on Twitter @Schnellinvestor if thats a platform you follow.
Lastly, I would like to take this opportunity to thank everyone who takes the time to read my work and tune into my webinars. The number of followers has increased signficantly year on year, so hopefully I can continue to deliver interesting commentary for you in 2017. Again, thank you.
Wishing you all the best in this holiday season and a happy, successful 2017!
Good trading,
Greg Schnell, CMT, MFTA.
