
The price relative tells us how a stock is performing relative to a market benchmark, such as the S&P 500. Even though this relative performance indicator is good for measuring relative momentum, it does not always tell the entire story. A stock can show weakness in relative momentum, but still have a bullish chart and a bullish setup worth taking. Let’s investigate further.
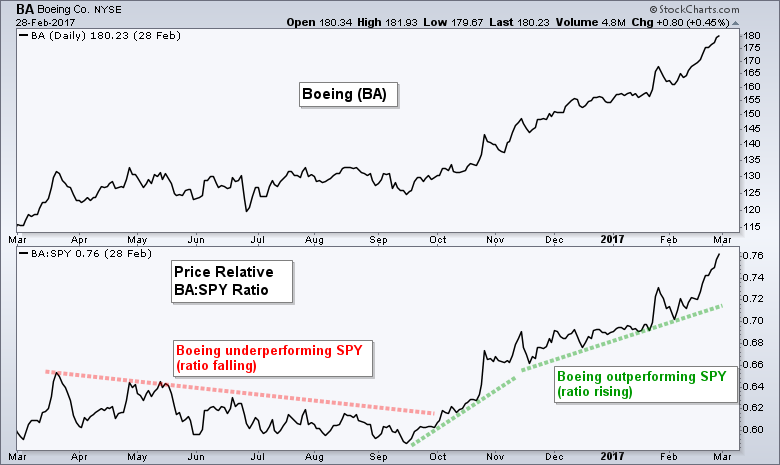
Chartists can measure relative performance by plotting a ratio of two symbols. This ratio plot is also known as the price relative or the relative strength comparative. The BA:SPY ratio shows us how Boeing is performing relative to the S&P 500 ETF (SPY). Boeing is rising at a faster rate (outperforming) when this ratio rises because the numerator (BA) is increasing relative to the denominator (SPY). Conversely, Boeing is falling at a faster rate (underperforming) when this ratio falls. The chart below shows Boeing underperforming SPY from late March to mid September as the price relative (BA:SPY ratio) fell. Boeing started outperforming in the second half of September as the price relative turned up.
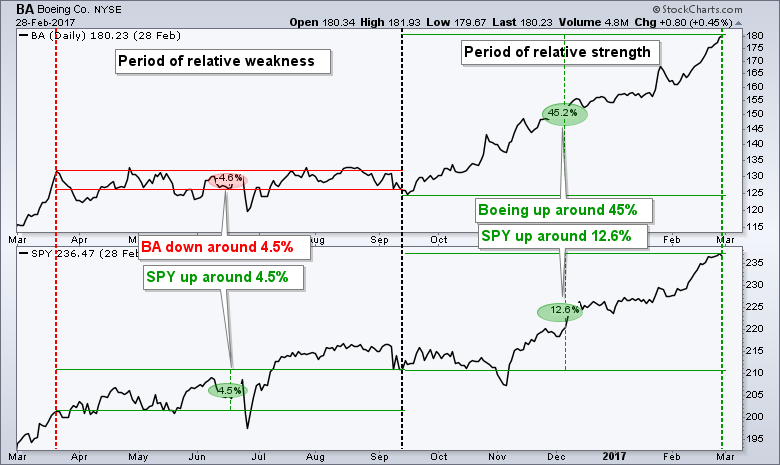
The price relative could also be called the relative momentum indicator because a stock with a higher Rate-of-Change than the S&P 500 ETF will typically have a rising price relative. Conversely, a stock with a lower Rate-of-Change than the S&P 500 will typically have a falling price relative. The next chart shows Boeing and SPY with the percent change for each period. Notice that Boeing declined from late March to mid September and SPY advanced during this period. Relative weakness is clear when BA falls and SPY rises. The second period shows BA rising around 45% and SPY rising just 12.6%. Both are in uptrends and strong, but Boeing is clearly rising at a faster rate than SPY. This could be referred to as relative “momentum” strength.
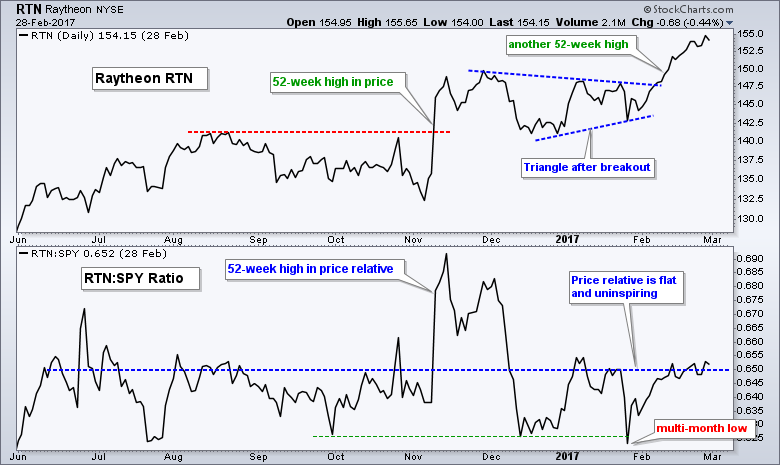
The price relative clearly has its uses as an indicator, but sometimes relative momentum is not telling the entire story. A stock with recent 52-week highs and an uptrend should not be ignored just because the price relative is flat or falling. The chart below shows Raytheon (RTN) in the top window and the price relative (RTN:SPY ratio) in the lower window. Notice that RTN broke out to a 52-week high in mid November and was clearly in an uptrend. The stock then formed a triangle to consolidate its gains and broke out again in February. A consolidation after a big surge is perfectly normal and there is nothing negative on this price chart. The price relative tells a different story because it fell back during the consolidation and even hit a multi-month low in late January.
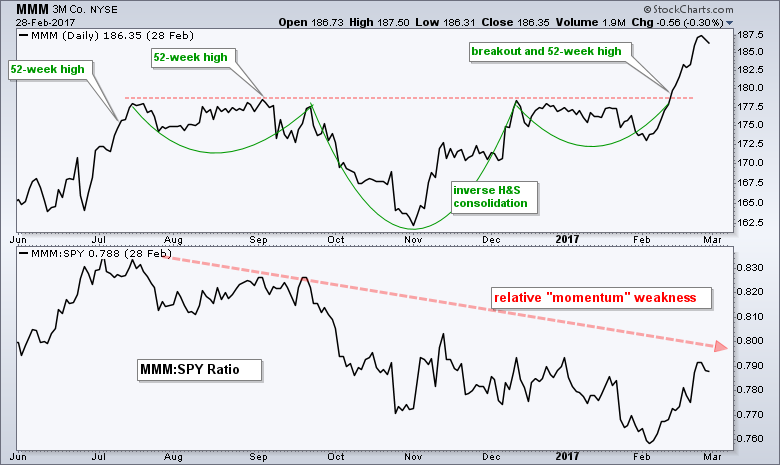
The second example shows 3M (MMM) with its price relative falling from July to February. The price relative fell as MMM consolidated with an inverse head-and-shoulders pattern, which is a bullish continuation pattern. MMM was up over 30% from January to July and the stock was certainly entitled to a rest after such a strong advance. This rest clearly ended when the stock broke neckline resistance to signal a continuation of its uptrend.
Over the years, I have come to the conclusion that the price chart is the single most important piece of the analytical puzzle. Indicators, which are derivatives of price, come a distant second. Indicators can enhance the analysis process, but they should not detract from what is actually happening on the price chart. Furthermore, price action overrules indicators because our profits and losses are dictated by changes in price.
Follow me on Twitter @arthurhill - Keep up with my 140 character commentaries.
****************************************
Thanks for tuning in and have a good weekend!
--Arthur Hill CMT
Plan your Trade and Trade your Plan
*****************************************
