
The Stochastic Oscillator is best known as a momentum indicator, but a careful look at the formula reveals that it can also be used to measure trend strength. As noted in a previous article on MACD, it is imperative that chartists fully understand an indicator to get the most out of it. The Stochastic Oscillator is a simple indicator that is really easy to understand. This article will start with a basic explanation and a few formula examples to explain the mechanics of the indicator. I will then show how it can be used to measure trend direction and strength over different timeframes.
What does the Stochastic Oscillator Actually Measure?
Let’s first look at the Fast Stochastic Oscillator (Fast STO) to learn exactly what it is telling us. The Fast STO measures the level of the close relative to the high-low range over a specific period. In other words, the high-low range is the scale and Fast STO plots the position of the close on this scale The classic 14-day setting measures the position of the close relative to the 14-day high-low range. In general, the indicator is above 80 when the close is near the 14-day high and below 20 when the close is near the 14-day low.
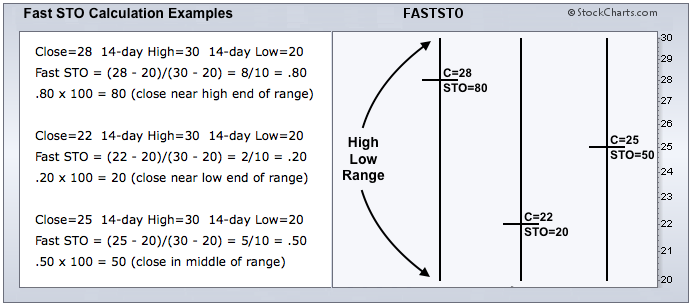
The formula for the 14-day Fast STO is the close less the 14-day low divided by the 14-day high-low range. In mathematical terms, it looks something like this: (Close - 14-day Low)/(14-day High - 14-day Low). The result is then multiplied by 100 to slide the decimal point two places. Three sample calculations are shown below with three bars for a visual. The vertical lines represent the scale (high-low range) and the horizontal lines mark the close.
The chart below shows Target with four different fourteen day periods on the price chart (shaded areas) and the corresponding levels for Fast STO. The first period shows a trading range and the close is near the middle of this range (Fast STO = 53). The second period shows the close near the upper end of the 14-day range and Fast STO is above 80. The third period shows the close near the low end of the 14-day range and Fast STO is below 20. Prices continued lower in the fourth period and the Fast STO remained below 20 for an extended time.

Slow STO, %D and %K
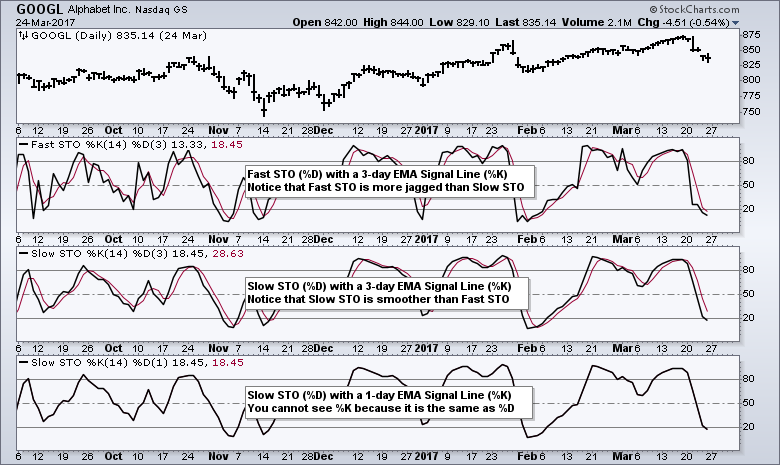
The Slow Stochastic Oscillator (Slow STO), which is the most popular version, smooths the Fast STO by applying a 3-day EMA. George Lane, creator of the indicator, also added a 3-day EMA as a signal line. Lane labelled Fast STO and Slow STO as %K, while the 3-day EMA is referred to as %D. In general, I prefer Slow STO because it filters out some of the noise. I do not use the signal line (%K) because I am not looking for momentum turns. %K, therefore, will be set to 1, which means it is a 1-day EMA of %D and the same as Slow STO. The chart below shows Google with three different Stochastic Oscillator to illustrate the differences.
Using Slow STO to Define the Trend
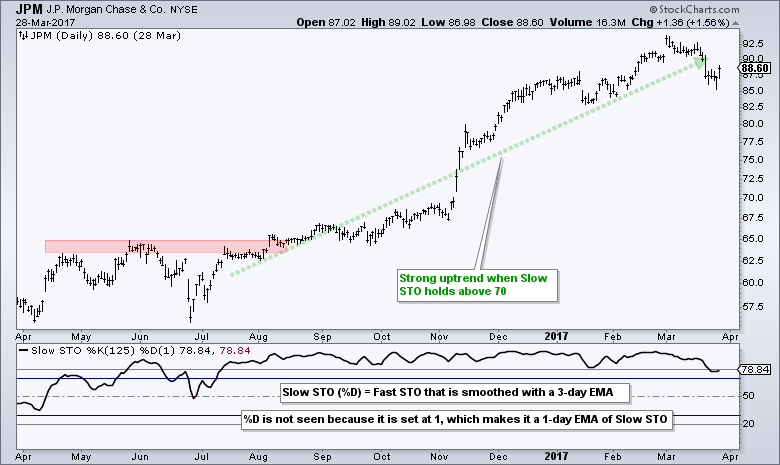
In general, prices are moving higher when Slow STO stays near the top of its range and lower when the indicator remains near the bottom of its range. Chartists can use a 125-day Slow STO to define the six month trend. In general, I would consider the trend up as long as Slow STO holds above 70. Conversely, the trend is considered down when Slow STO remains below 30. The first chart shows JP Morgan (JPM) with the 125-day Slow STO moving above 70 in mid July and holding above this level the next eight months as a strong uptrend unfolded. This is a stock we want to have on our watchlist for bullish opportunities, such as pullbacks within an uptrend.
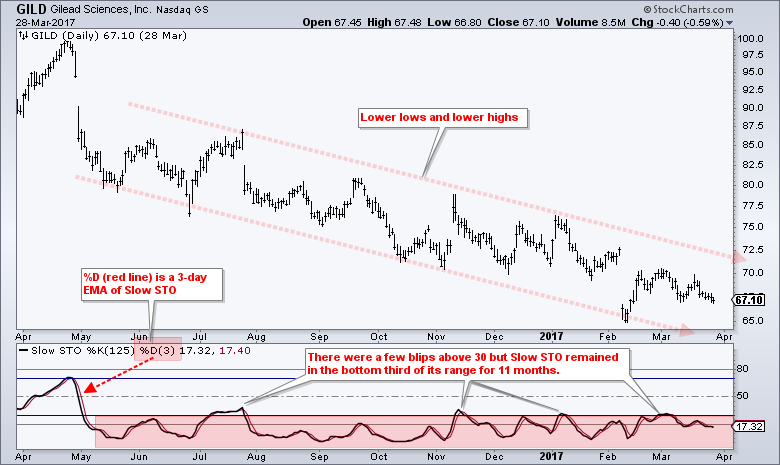
The second chart shows Gilead Sciences (GILD) with a steady downtrend from May 2016 to March 2017. The 125-day Slow STO moved above 30 four times during this downtrend, but did not hold above 30 for long and did not come close to breaking into the top half of the Stochastic range (above 50). Notice that the stock formed lower lows and lower highs as Slow STO floundered in the bottom third of its range. Gilead is clearly a stock to avoid because of the strong downtrend.
Indentifying 52-week Highs (and Lows)
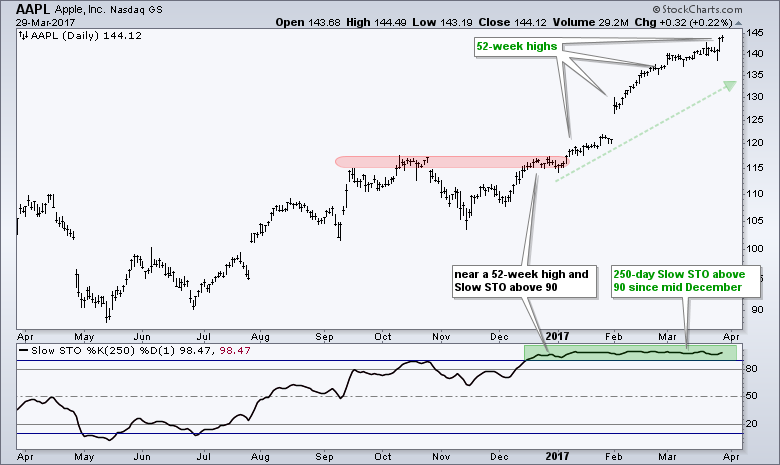
Stocks trading near 52-week highs are clearly in strong uptrends and Slow STO can be used to capture this kind of strength. Set at 250 days or 52 weeks, the indicator covers one year and measures the position of the close relative to the one year high-low range. Stocks with a Slow STO above 90 are close to 52-week highs and in strong uptrends. Conversely, stocks with a Slow STO near 10 are close to 52-week lows and in strong downtrends. This is valuable information that chartists can use as part of a trading strategy. The example below shows Apple nearing a 52-week high in mid December as the 250-day Slow STO exceeded 90. The indicator remained above 90 as Apple pushed ahead to 52-week highs in January, February and March.
Conclusions
The Stochastic Oscillator is clearly more than just a short-term momentum oscillator. This becomes clear when we fully understand the formula and timeframe settings. Chartists can use 21 days to determine the position of the close relative to the high-low range over the past month. I prefer to use it as a long-term measure of trend strength with look-back periods that cover six to twelve months (125 to 250 days). The level of smoothing is also a choice to consider. The Fast STO has no smoothing and will hit 100 when the close is at the exact high of the look-back period. Slow STO, which has built in smoothing, will not hit 100 as often. Chartists can also consider tinkering with this smoothing parameter. Bottom Line: the Stochastic Oscillator can be used to measure trend strength and find stocks in strong uptrends.
Follow me on Twitter @arthurhill - Keep up with my 140 character commentaries.
****************************************
Thanks for tuning in and have a good day!
--Arthur Hill CMT
Plan your Trade and Trade your Plan
*****************************************
