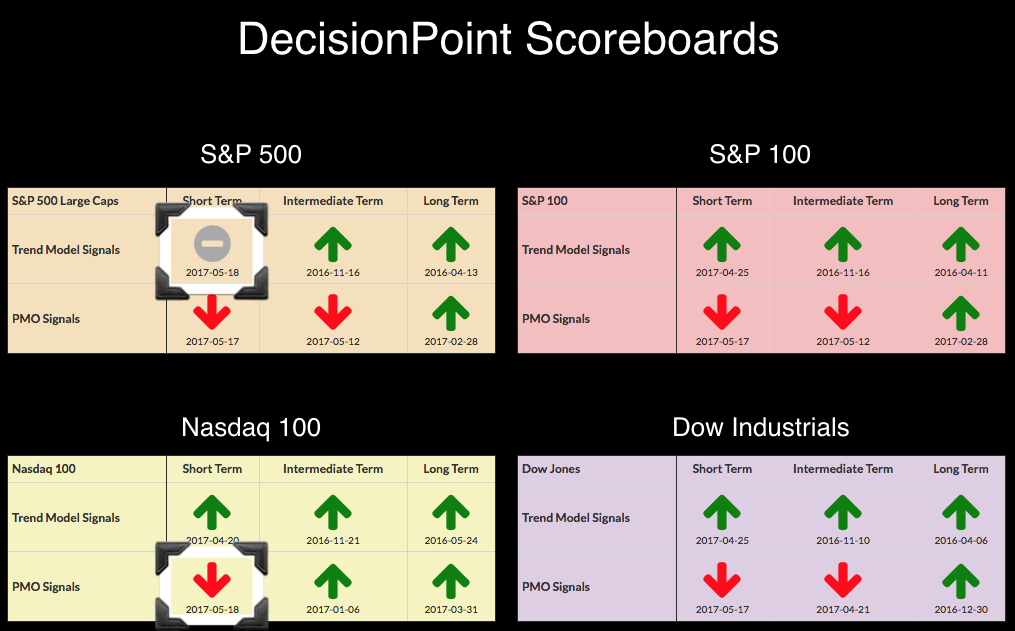
It was a rough finish to the week and it has shaken up the DecisionPoint Scoreboards. Additionally, the Intermediate-Term Trend Model (ITTM) generated a Neutral signal on the equal-weight Financials ETF (RYF) and a weekly Price Momentum Oscillator (PMO) SELL signal popped on the equal-weight Consumer Discretionary ETF (RCD). Believe it or not, these Scoreboards were completely green on May 11th (except the Dow IT PMO SELL). We began seeing signs of deterioration even before this week's short-term correction when the IT PMO signals on the SPX and OEX triggered a SELL signal on 5/12.
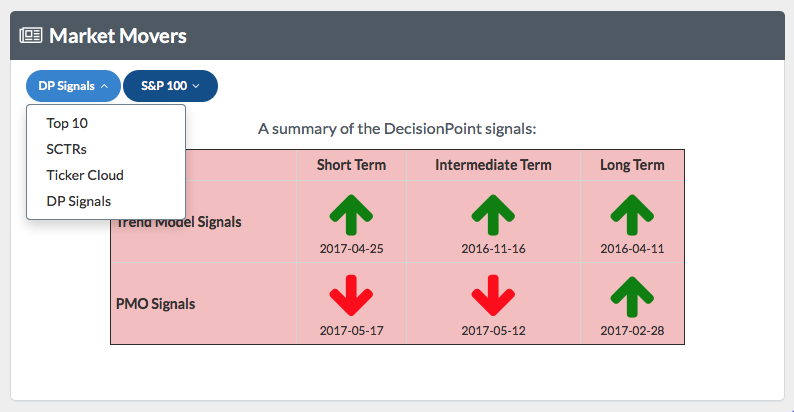
You can now find these Scoreboards right from your member dashboard! Under "Market Movers" in the first drop-down menu, simply select "DP Signals". The second drop-down will allow you to choose which of the four Scoreboards you'd like to view.
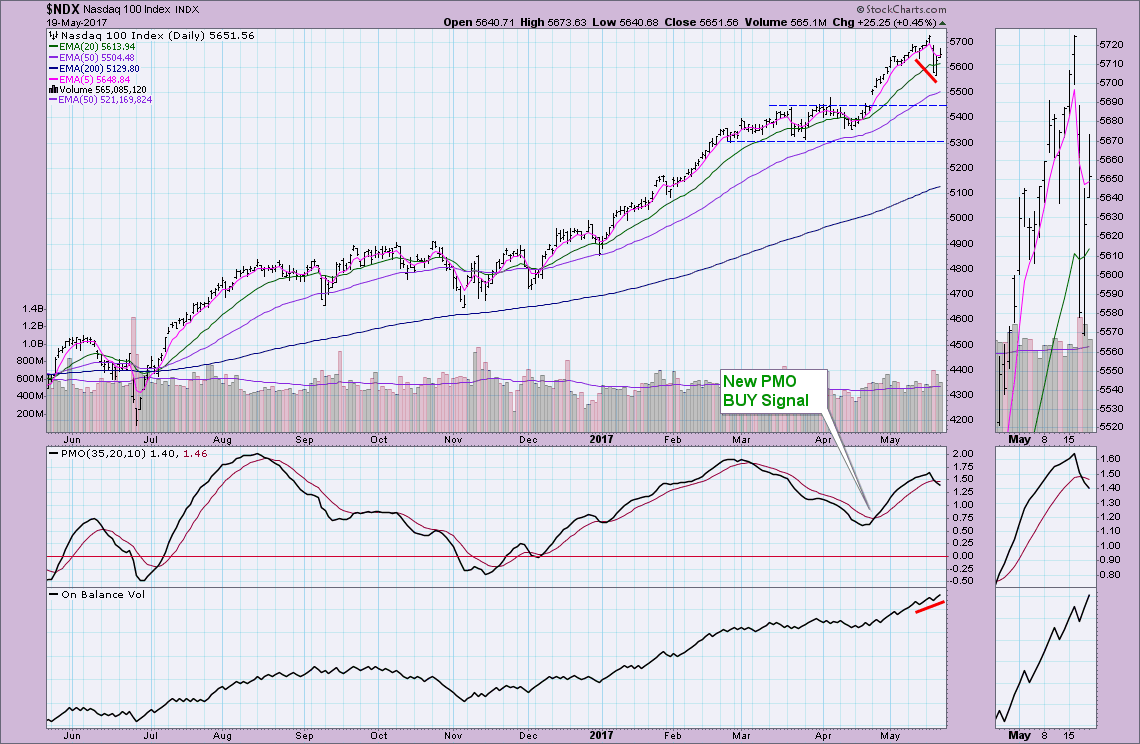
The two signals generated today were on the Nasdaq 100 and S&P 500. You'll see on the daily chart of the NDX below that 20-EMA support was breached with this week's pullback. This is what pulled the PMO below its signal line to generate a PMO crossover SELL signal. This new signal would suggest the pullback will become a correction down to support around 5450. I'm not looking for a move that low. This bull market has seemed to survive on consolidation to clear overbought conditions and I suspect we will see the same on the NDX. The OBV is showing a very nice positive divergence that suggests to me a big time correction isn't likely on tap just yet. We're clearly not out of the woods until the PMO starts to confirm upside momentum with a reversal.
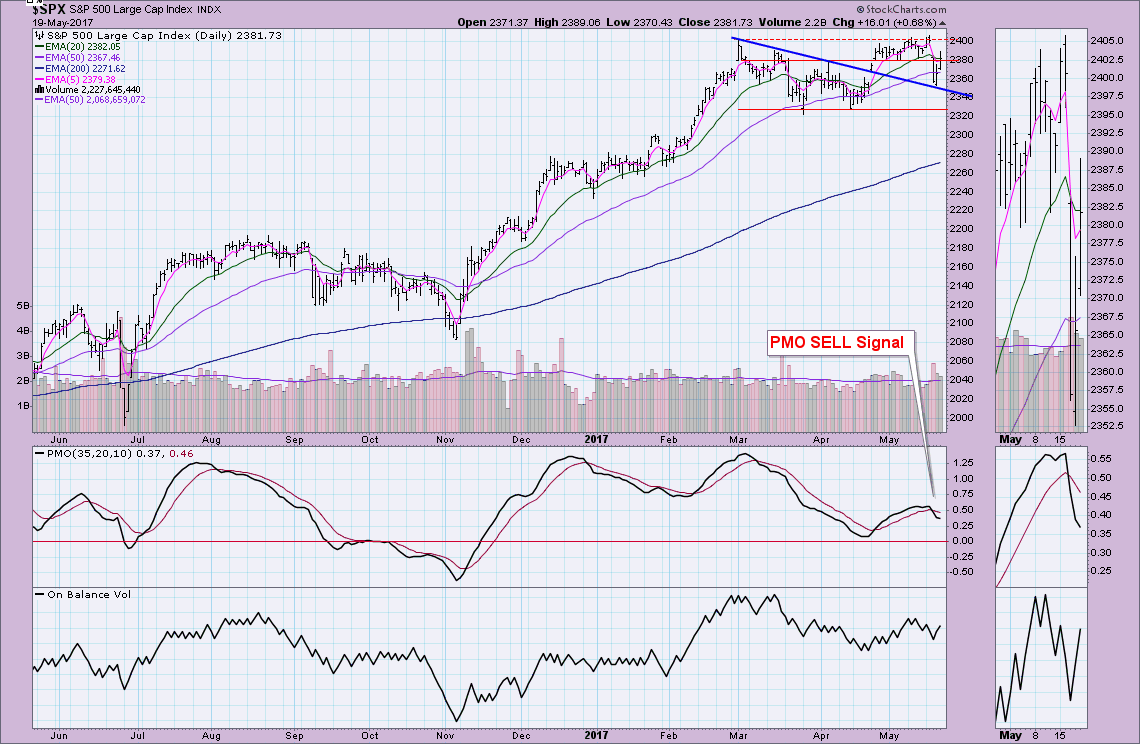
I like that the SPX found support along the declining tops trend line. Price managed to just sneak in to close above support at 2380. I also note that the PMO is beginning to decelerate on the recovery today and yesterday.
If you'd like to see the weekly charts and the SELL signals that generated last Friday, you can read my article about those signal changes right here.
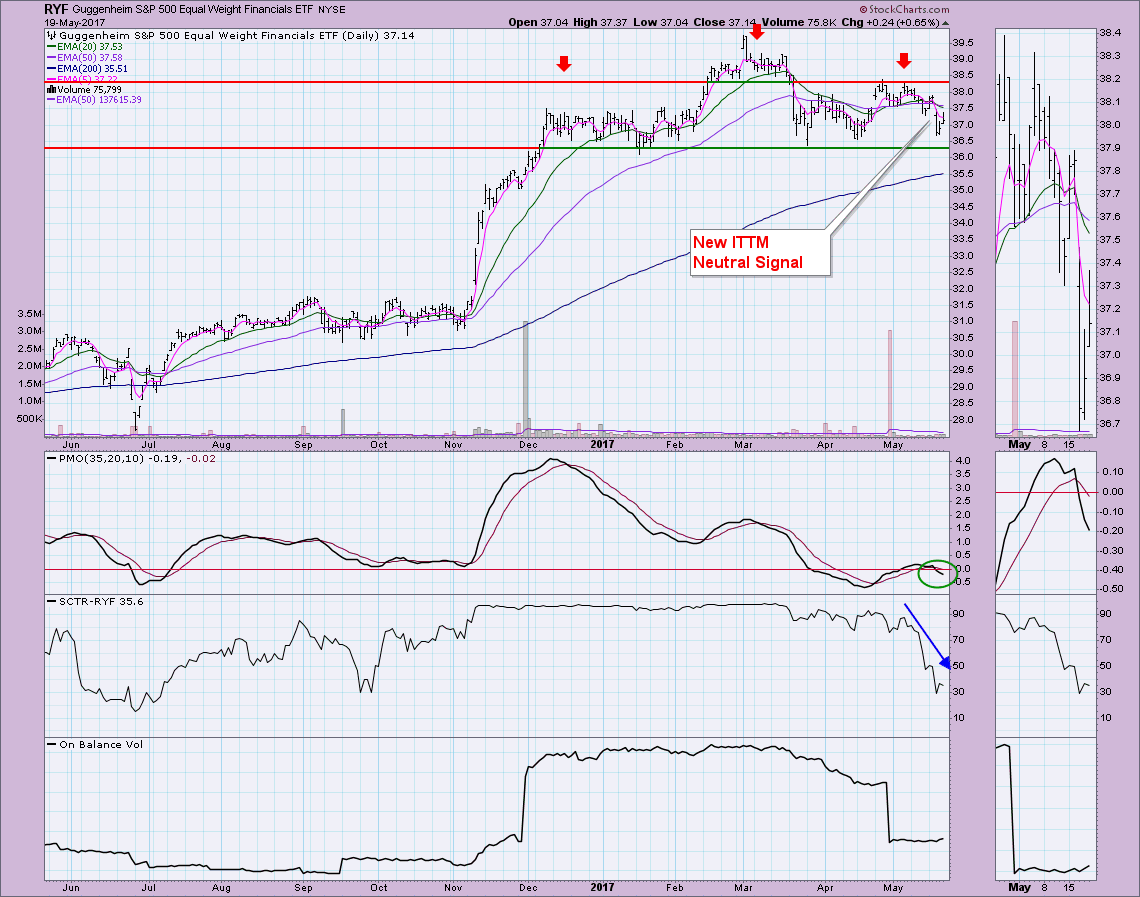
The equal-weight Financials ETF (RYF) generated an ITTM Neutral signal yesterday when the 20-EMA crossed below the 50-EMA while the 50-EMA was above the 200-EMA. Greg and I actually talked about the Financial sector today. While this is a good place to find a strong bottom after support was tested Wednesday, the indicators are not favorable. Not only do we see the 5-EMA < 20-EMA < 50-EMA, the PMO is still falling and the SCTR has taken a dive. This is bad, but add to that the possibility of a head and shoulders pattern and we could have a recipe for disaster.
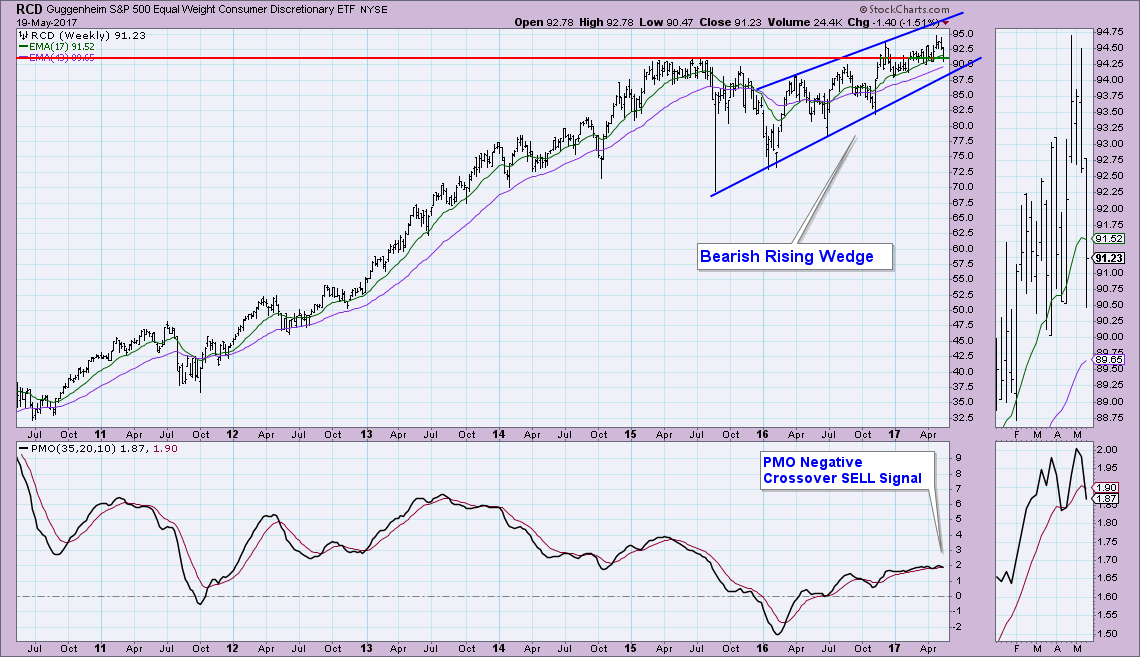
Today an IT PMO SELL signal was triggered on the weekly chart for the equal-weight Consumer Discretionary ETF (RCD). Like Financials, Consumer Discretionary stocks tend to lead in a bull market, while in periods of uncertainty or in anticipation of a bear market, they begin to lag. Equal-weight ETFs tend to turn over more quickly than the SPDRs so be ready. Support was breached this week, but price closed back above. The bearish rising wedge is a concern for the intermediate term. The expectation of a bearish wedge is a breakdown.
Conclusion: The markets have softened up quite a bit this week with Wednesday's pullback. The large drop pulled PMOs downward fast enough to trigger SELL signals and while the market has been recovering yesterday and today, PMOs are still declining. Seeing both the equal-weight Financials (RYF) and Consumer Discretionary ETFs (RCD) triggering bearish signals is also a flag that the intermediate-term picture is bearish.
Helpful DecisionPoint Links:
DecisionPoint Shared ChartList and DecisionPoint Chart Gallery
Price Momentum Oscillator (PMO)
Swenlin Trading Oscillators (STO-B and STO-V)
Technical Analysis is a windsock, not a crystal ball.
Happy Charting!
- Erin
