Energy stocks have been declining since December for the most part. This would be one of the best clues that the investors do not like the trends inside the industry. Now the Bullish Percent Index for Energy is under 20%. Here is the good news. The sector can stay down here for a while, but eventually, these stocks will come to life. As a matter of fact, there is a nice rhythm in the momentum for energy stocks. Let me put a few charts up to whet your appetite for a little black wine sometime later this year.
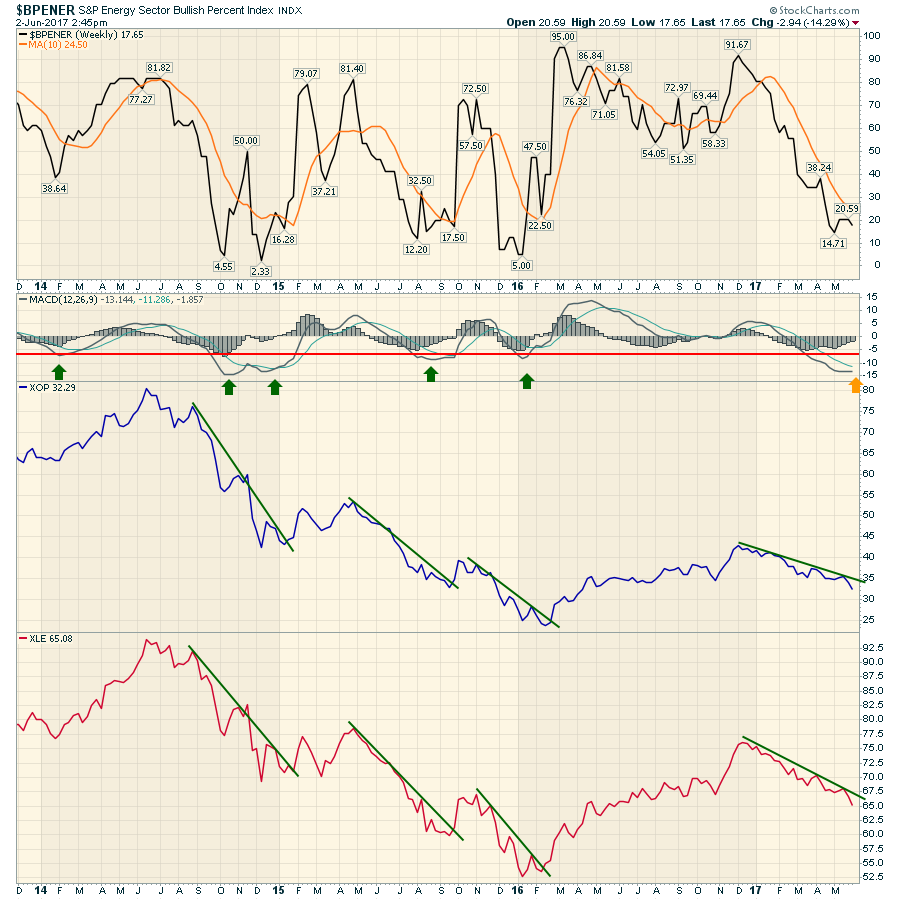
First of all, here is the Bullish Percent Index for Energy ($BPENER). We can see the Index is near the lowest levels of the last few years. The level around 15% to 20% is usually where meaningful bottoms are built. We can also see the momentum shown by the MACD is very low. The MACD is also flattening out here. So, the first clue for us is that the downside momentum is waning somewhat but that does not mean the bottom is in for energy stocks. You can see that looking at the Exploration and Production ETF (XOP) as well as the Energy Sector ETF (XLE).
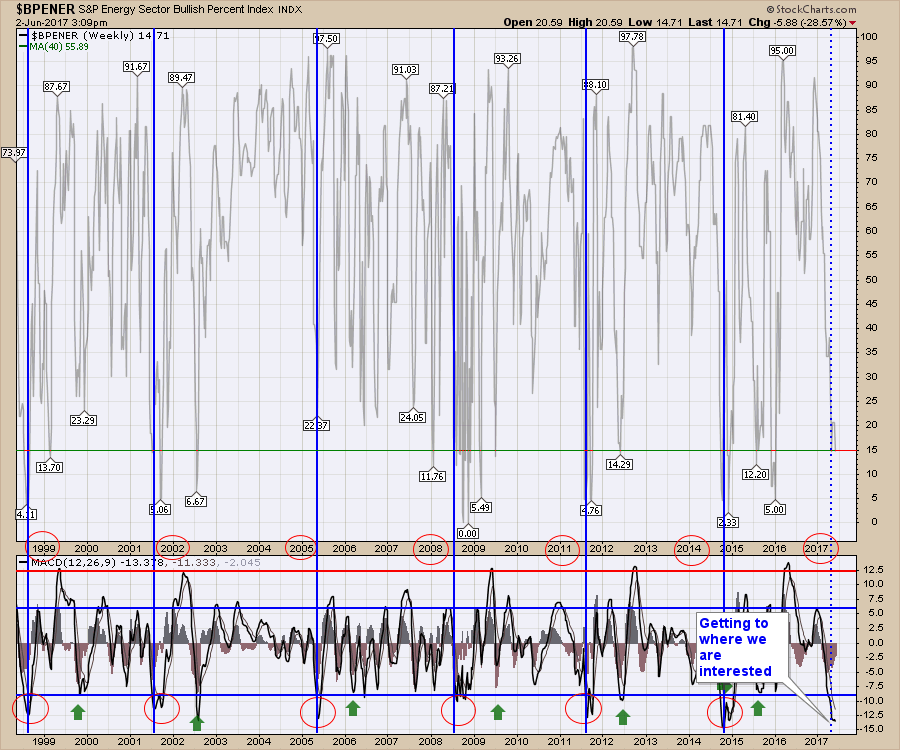
If we take the $BPENER chart and show the last 18 years, you can see a low momentum cycle roughly every 3 years. Why I think this is particularly interesting is that we are at one of the lowest readings already.
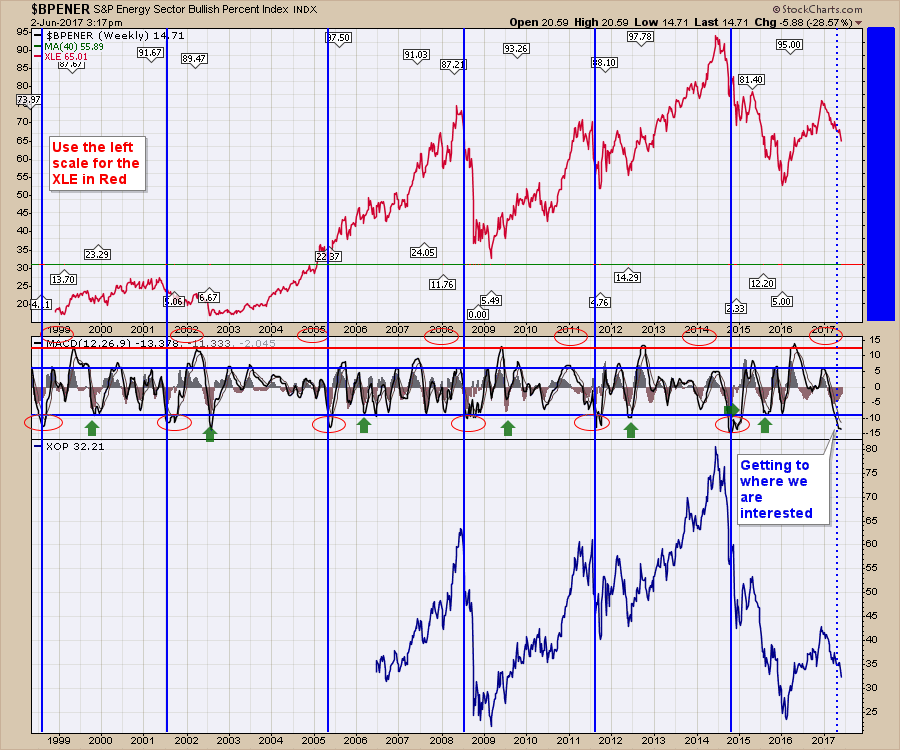
 On the next chart I could have set the $BPENER data to 'invisible' or by setting Opacity to zero to hide it. After doing that, I still want to keep the MACD for the $BPENER and input the XLE and XOP data. The result is below. We have more history for XLE than XOP. In most cases the bottom shows up a few months later. You can always click on these charts to see the settings used.
 I'll be watching and analyzing this chart with great interest over the next few months on the Commodities Countdown Weekly Video. Hopefully you'll find some time to view the video. We'll be using the SCTR and numerous other indicators to help us as the sector turns. We will be waiting for the stocks to create some uptrends but we won't be waiting for new 52 week highs. It should be an exciting place to get long the energy sector, but we'll need to wait for the setup to finish. We should also see some of the strong stocks bounce before the ETF's like XOP and XLE bottom out. There is more data on the Commodities Countdown 2017-06-01. You can also click on the gray 'Follow' button to the right on the Greg Schnell Vimeo Channel to be alerted when I put up another video.
I was involved with three video's this week. The Canadian Technician 2017-05-30, Commodities Countdown 2017-06-01 and Martin Pring's Monthly Market Round Up 2017-06-02. There is a lot of content there for your weekend absorption. A major concern is the difference in Commodity related country charts and the other countries.
Market Outlook June 10th 2017 at 11 EDT.
Tom Bowley and Greg Schnell will be presenting their summer view on the StockCharts Market Outlook Webinar Saturday, June 10th at 11:00 to noon EDT. Click here to register. If you haven't joined in on a Saturday morning, you'll find a great webinar with lots of good trends and ideas being presented. Tom and Greg are not selling anything, its a webinar presenting some macro trends that are emerging and we will share those ideas with you.
Blog updates
To be updated when articles are posted on blogs, click on the 'Notify Me' button at the bottom of an article in each blog once. Here are the links to the various blogs I post on. The Canadian Technician. Commodities Countdown. Don't Ignore This Chart. Chartwatchers.
Good trading,
Greg Schnell, CMT, MFTA.
