ChartWatchers July 15, 2017 at 07:19 PM
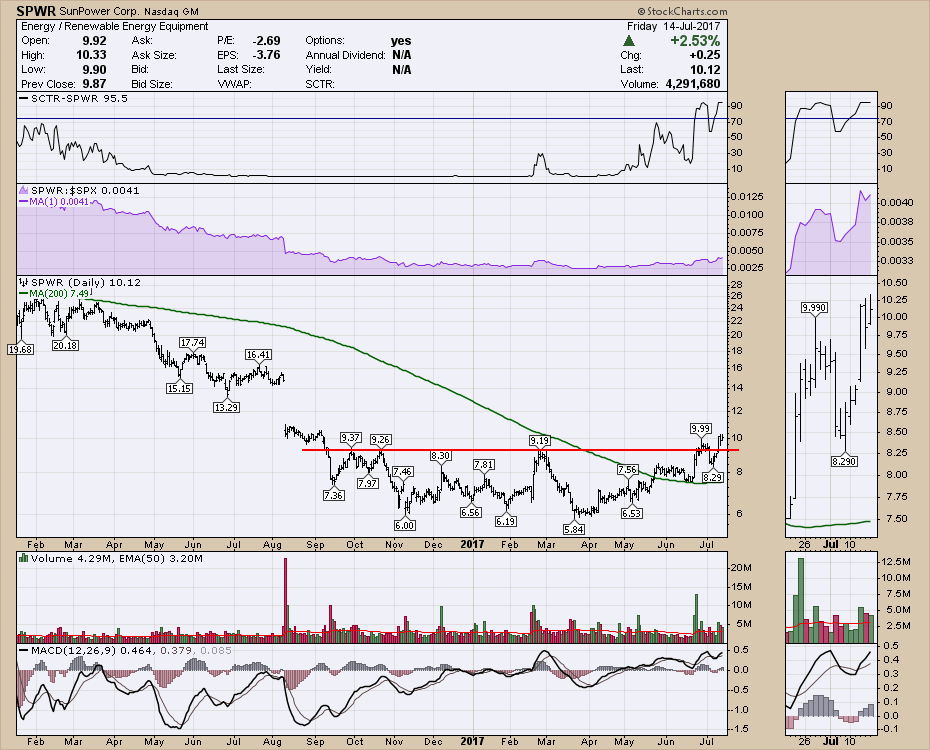
Solar stocks are starting to shine after a year in the unloved corned of the market. First Solar is the industry leader and a Don't Ignore This Chart article was published on it in June. There are some others in the group starting to perform as well... Read More
ChartWatchers July 15, 2017 at 02:50 PM
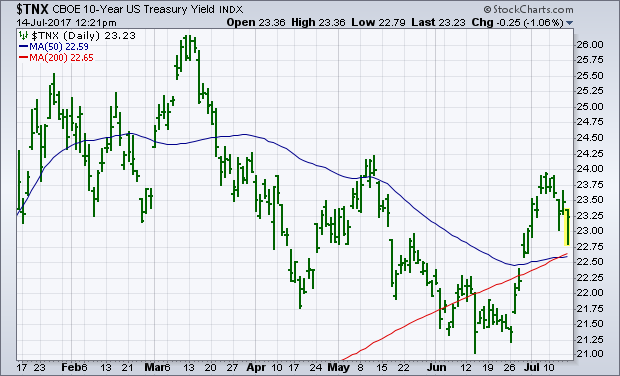
BOND YIELDS DROP ON LACK OF INFLATION ... June's CPI report showed no change from the previous month, reflecting the absence of inflation. Its annual gain of 1.6% was the smallest since last October. Excluding food and energy, the core CPI saw a modest monthly bounce of 0... Read More
ChartWatchers July 15, 2017 at 02:44 PM
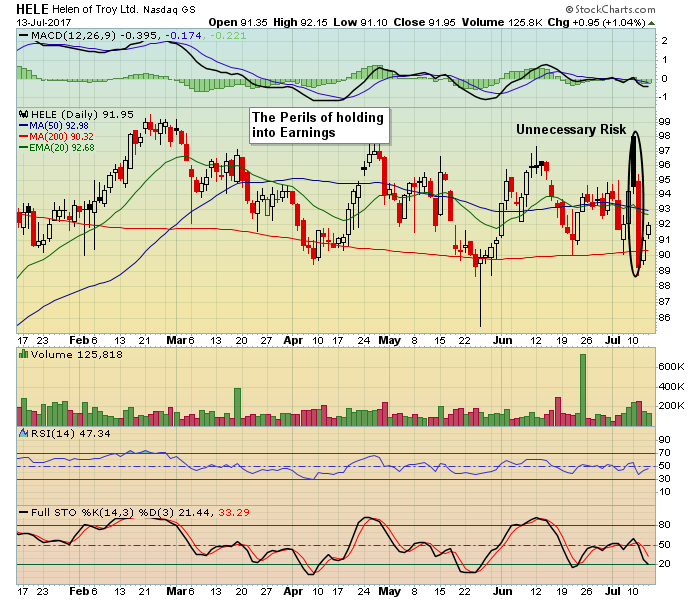
Q2 Earnings Season is underway with 4 of the nations largest banks reporting their numbers Friday and thousands of companies getting ready to report over the next few weeks. Earnings season brings with it both the highs and lows of trading... Read More
ChartWatchers July 15, 2017 at 02:20 PM
As a stock market historian, if there's one thing that really annoys me, it's the talking heads saying to "go away in May". While the May through October period is clearly less bullish than its November through April counterpart, there are loads of reasons to be long U.S... Read More
ChartWatchers July 14, 2017 at 03:28 PM
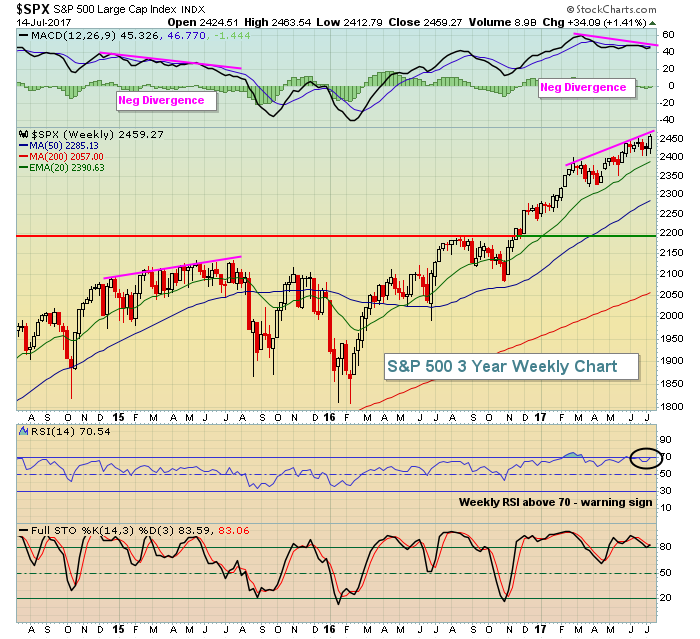
On Fridays during the MarketWatchers LIVE show (12:00p - 1:30p EST), I do a regular segment that checks what weekly sentiment charts are telling us... Read More
ChartWatchers July 01, 2017 at 12:48 PM
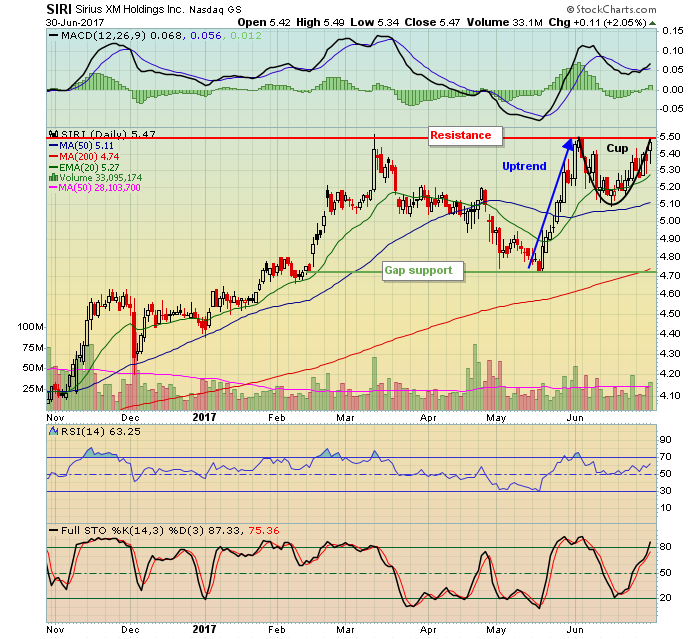
It's generally not a great idea to wait until after a stock or index breaks out to consider short-term trades. It would seem somewhat obvious to instead plan for those breakouts by watching patterns develop and keeping an eye on volume... Read More
ChartWatchers July 01, 2017 at 02:07 AM
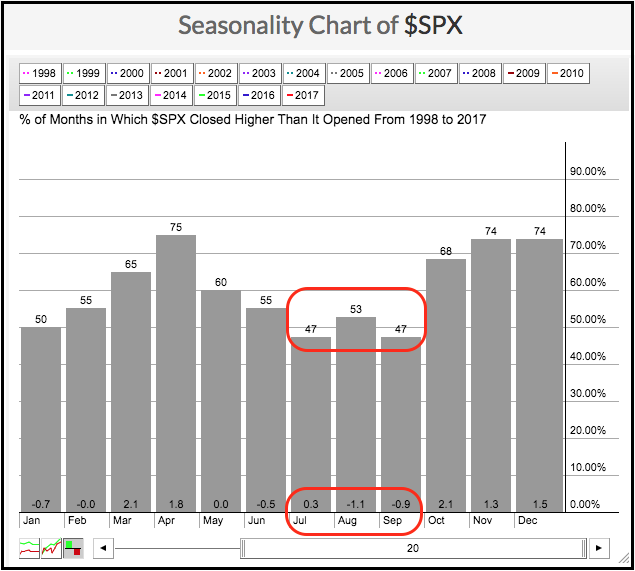
The chart below shows the seasonal tendency for the S&P 500 over the last twenty years (1998 to 2017)... Read More