Sentiment charts haven't been all that enlightening with mostly neutral readings. However, we are reaching bearish levels that generally result in a rally. Here's my interpretation of the latest sentiment from the put/call ratios, AAII, NAAIM and Rydex Ratio.
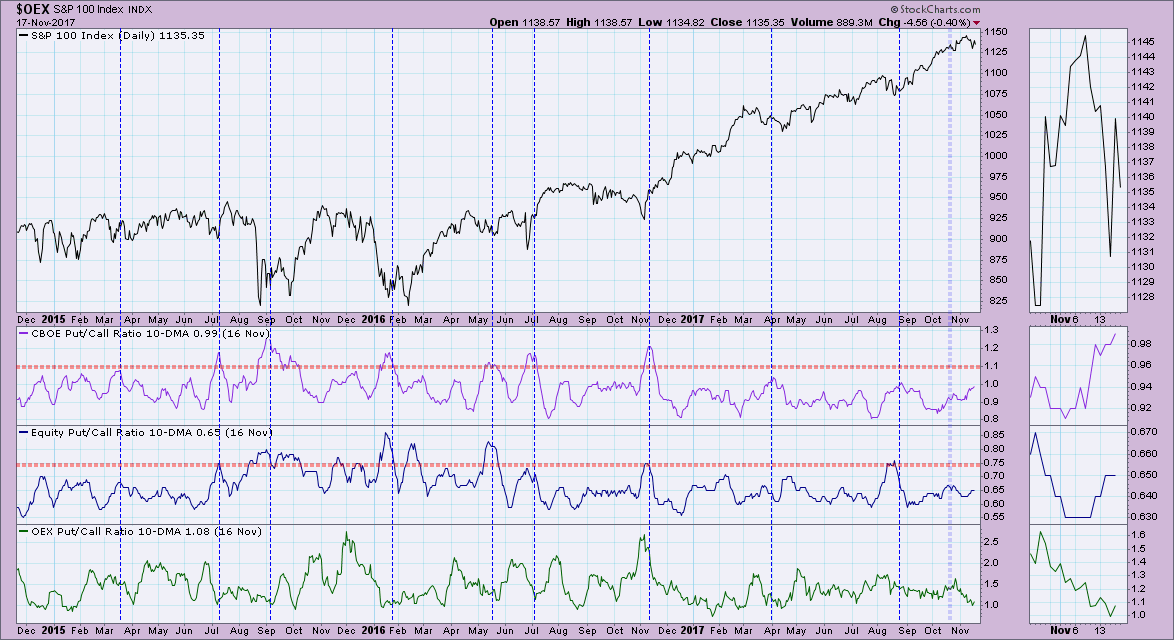
What I pointed out in today's MarketWatchers LIVE show was that the CBOE put/call ratio is reaching near-term overbought territory. The Equity put/call ratio isn't so overbought, but it is still stair stepping higher. The OEX put/call ratio is many times used as a hedge so I actually look for those ratios to bottom in oversold territory, which they are preparing to do.
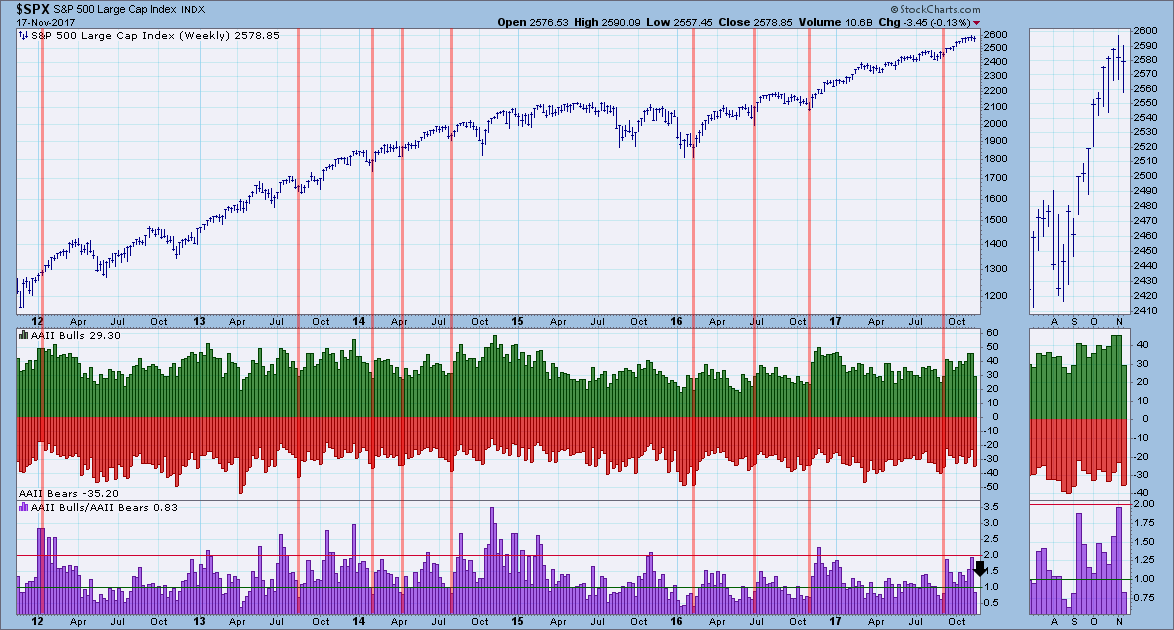
The amount of bears is high and the ratio is bearish. Notice the drop in bulls from the past two weeks until this week. I've annotated some of the results from previously low bull/bear ratios.
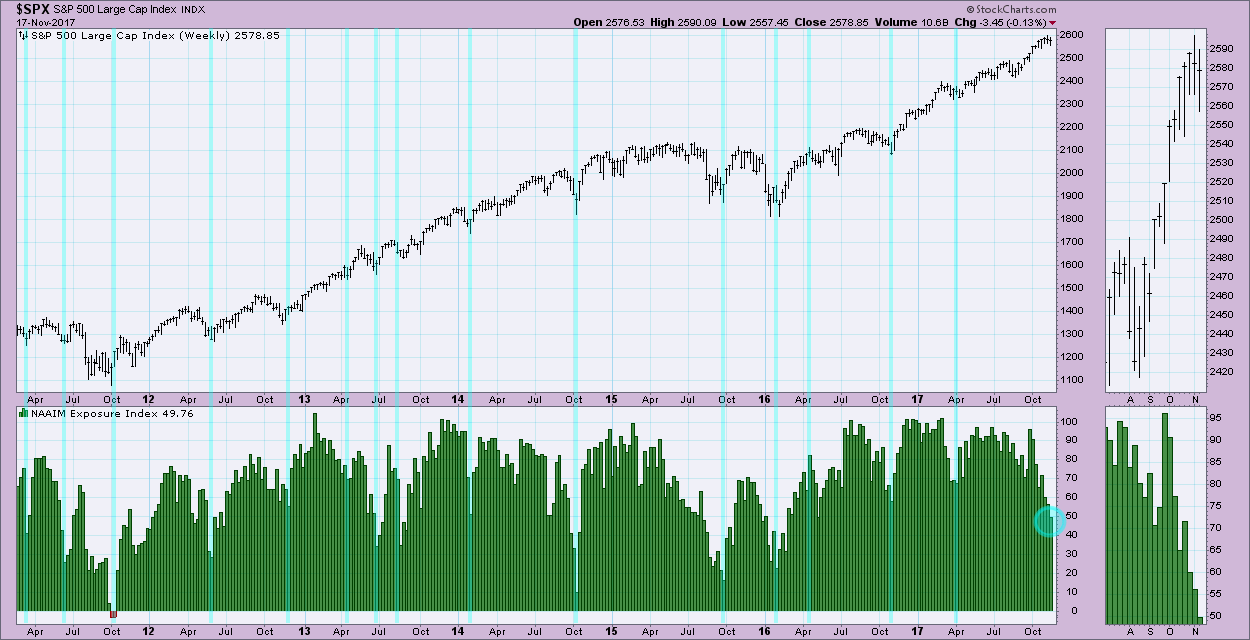
This chart is the one that spoke to me today. The exposure for NAAIM is tumbling. When active investment managers begin lowering their exposure to the market, they are bearish. We've seen lower exposure readings but notice that those tended to come after deep declines, not consolidation as we're seeing now. So we are seeing exposure levels we typically see after a corrective move or at least a pullback. I find it interesting that the market hasn't experienced a real decline, yet exposure has been pulled back quite a bit. Sentiment being contrarian--I believe this is bullish going forward.
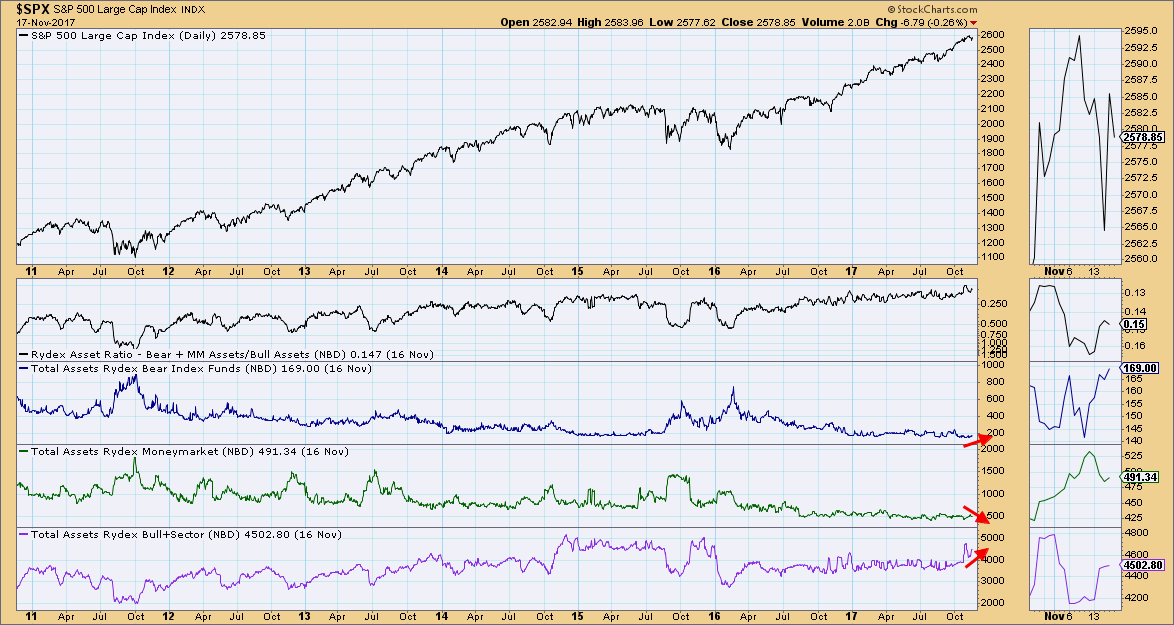
The Rydex Ratio is a "money where your mouth is" survey. DecisionPoint tracks the assets in bear funds, bull funds and cash. The thumbnail is where the action is. Money is coming out of cash and moving more quickly into bear funds than equity funds. No longer are investors interested in being in cash, they are beginning to feel bearish enough to move into the bear funds.
Conclusion: Remember that sentiment is a contrarian indicator. We want to see the world become very bearish because that is when the rally comes along. Watch MarketWatchers LIVE on Fridays where I go over the latest sentiment charts.
Helpful DecisionPoint Links:
DecisionPoint Shared ChartList and DecisionPoint Chart Gallery
Price Momentum Oscillator (PMO)
Swenlin Trading Oscillators (STO-B and STO-V)
Technical Analysis is a windsock, not a crystal ball.
Happy Charting!
- Erin
**Don't miss DecisionPoint Commentary! Add your email below to be notified of new updates"**
