If you've been reading the DecisionPoint Blog lately or watching the MarketWatchers LIVE show on StockCharts TV, you know that I have been expressing concern over the sector rotation over the past few weeks and month. Over the past month, the worst performer is the Technology sector, followed by Financials which also took a hit. The highest performers by far have come in the more defensive areas of the market. If rallies come on the back of the defensive areas of the market, that is a sign of a bear market in the making.
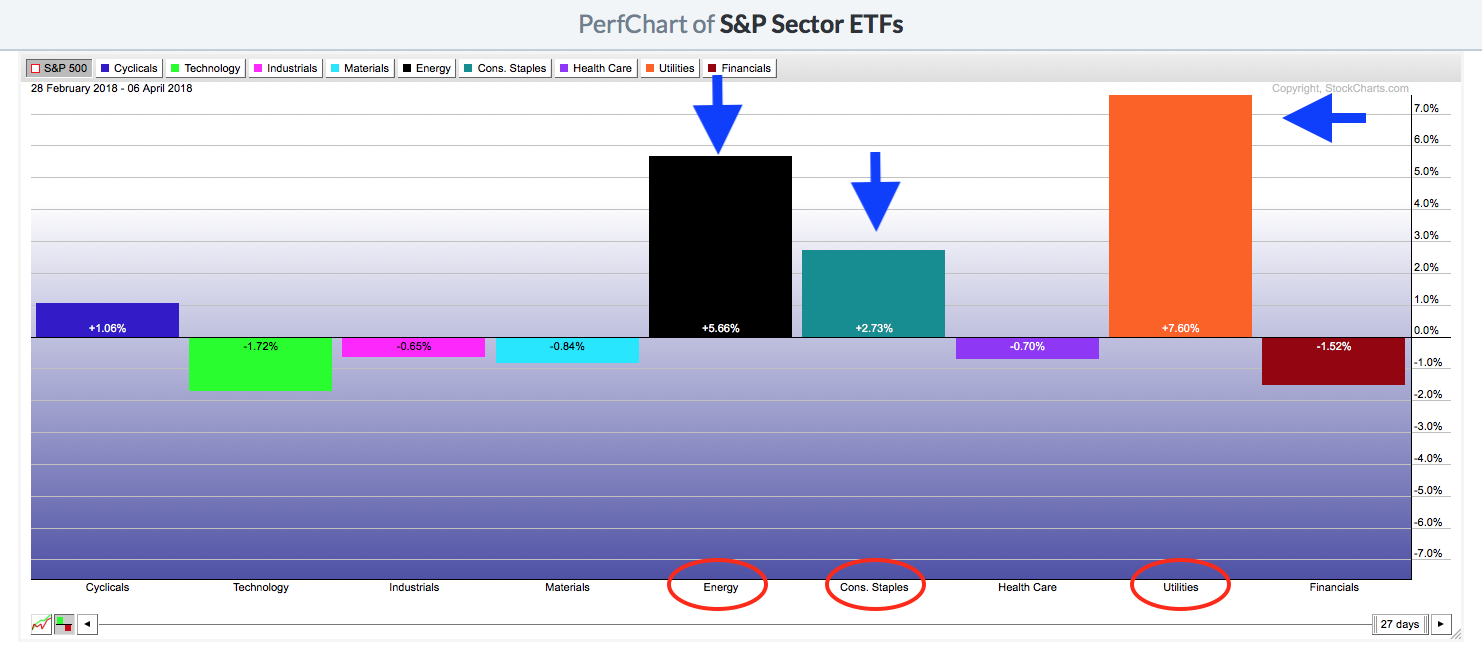
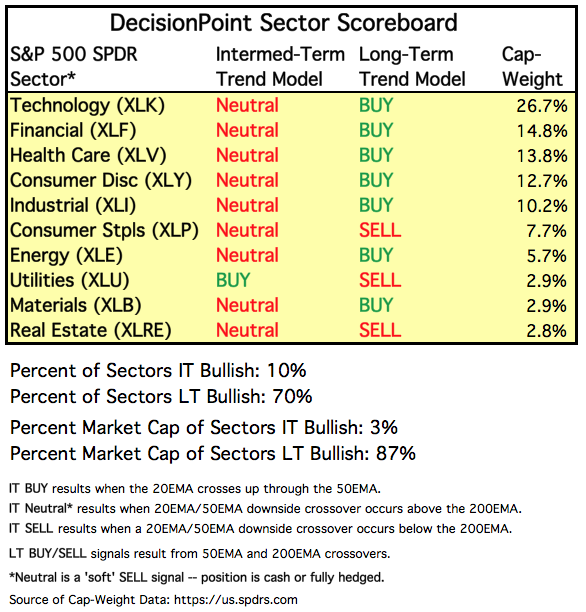
This week, we lost IT Trend Model BUY signals on both the aggressive Technology and Financial sectors, followed by a new IT Trend Model BUY on the Utilities sector. This sector is poised to perform well going into the next month.
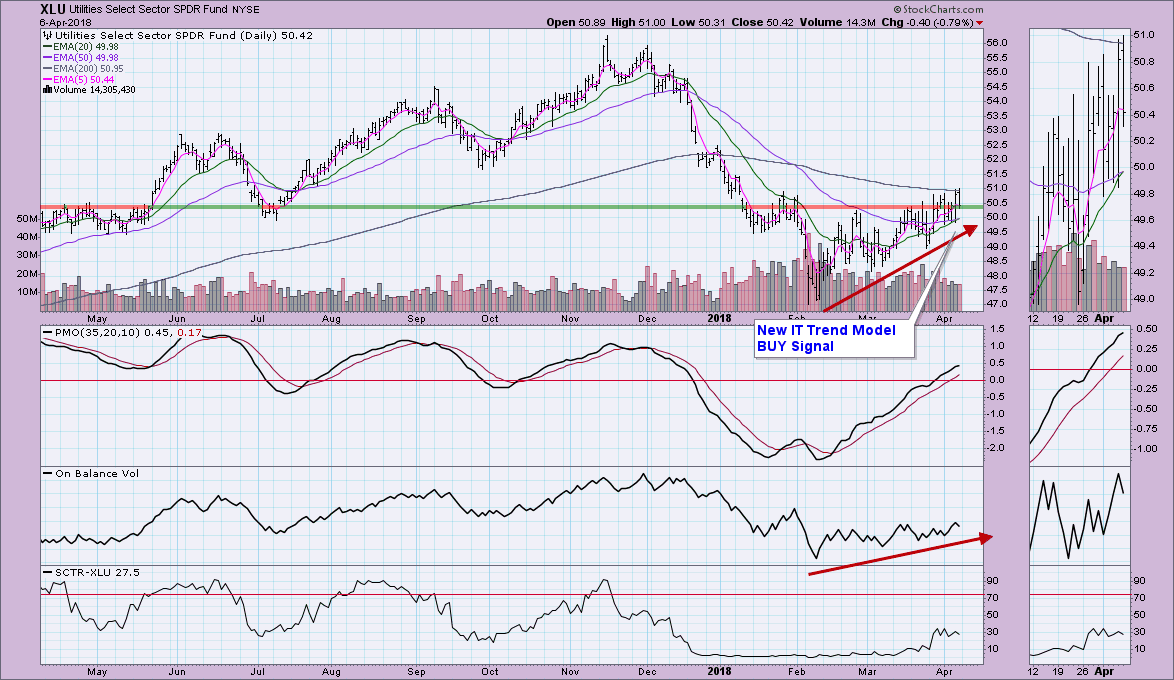
We saw two nice breakouts above resistance at the $50.50 level. Unfortunately, it didn't hold that level, but closed lower today. I also don't care for the inability of price to close above the 200-EMA. The new IT Trend Model BUY signal was triggered when the 20-EMA crossed above the 50-EMA. I still like this chart. The new BUY signal combined with a now positive PMO and rising OBV bottoms that confirm rising price bottoms. I'll be looking for Utilities to continue to perform.
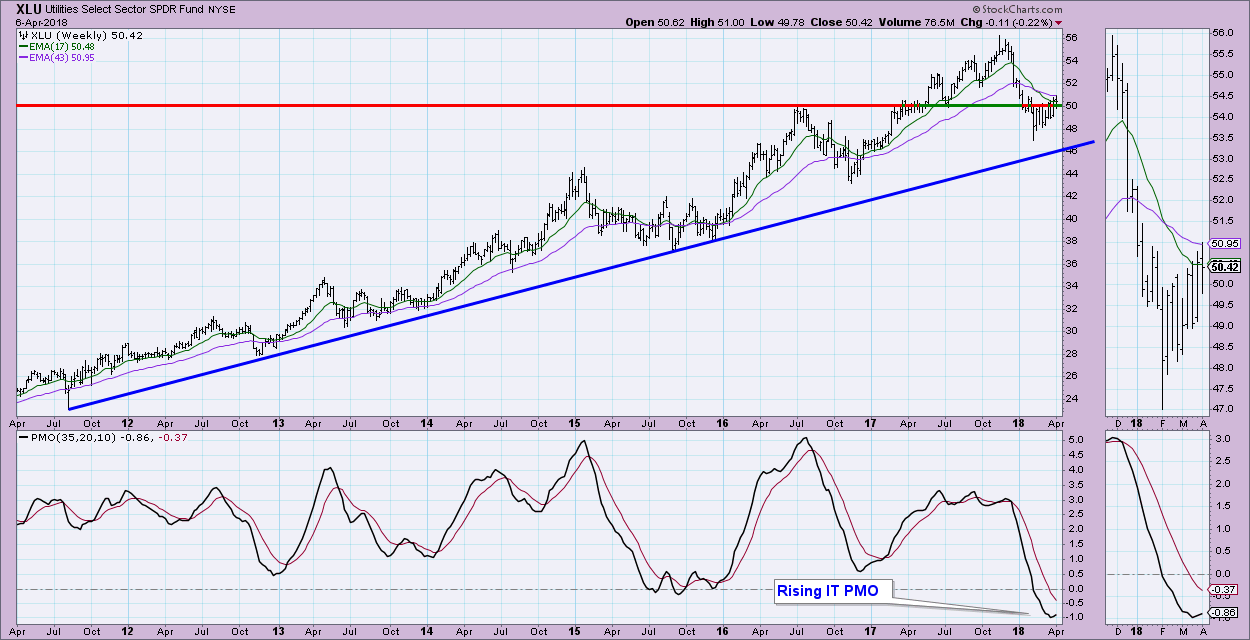
The weekly chart is very favorable. The PMO is turning up in oversold territory. Note that the recent price bottom didn't need to fully test rising bottoms support before angling higher. Note the $50 level also coincides with the 2016 price top in addition to the 2107 low in July. This strong resistance has been broken. Price is nearly above the 17-week EMA which is also positive.
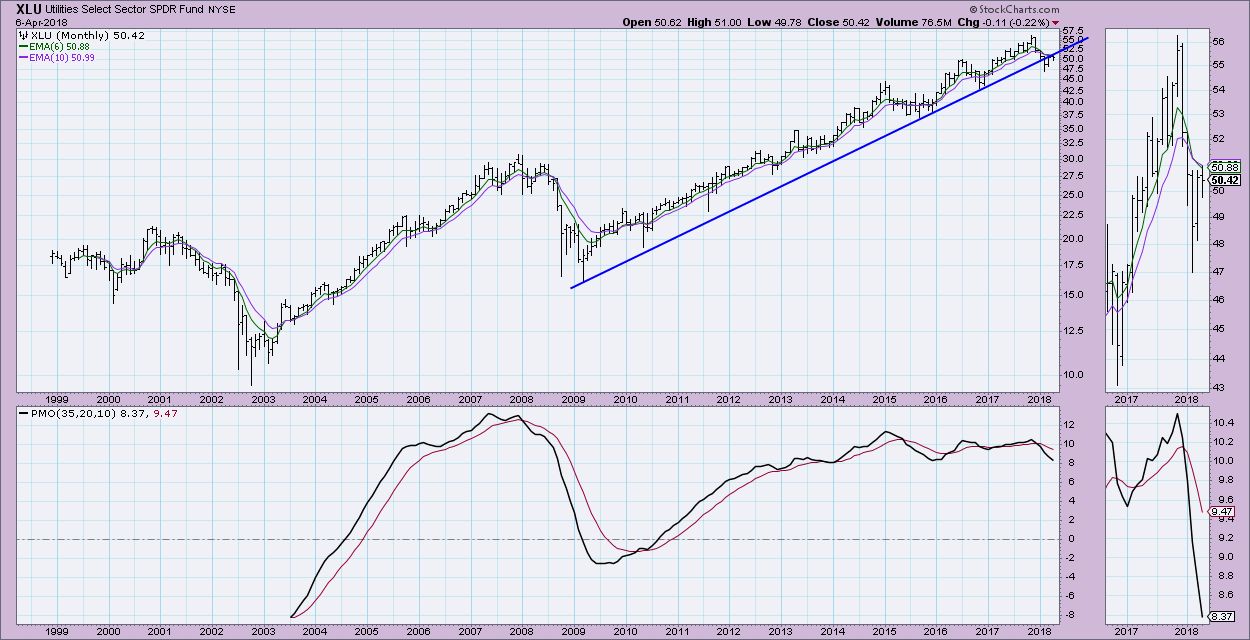
The monthly chart isn't as bullish. In fact, I'd say it is bearish right now. We had a break below a very long-term rising bottoms trendline. The LT PMO is on a SELL signal and it is not slowing its descent.
Conclusion: I'd love to get on board the "worst is over" bandwagon, but I can't yet. Sector rotation has me bothered (although Greg Schnell made a point that the defensive sectors should be performing well for about 3 months before sector rotation is yelling 'danger') in the short term. I will continue to keep tabs on this as we proceed. We needed the market to hold 200-EMA support and it did. The jury is out whether the rally will continue...I'm leaning toward consolidation along the 200-EMA.
Helpful DecisionPoint Links:
DecisionPoint Shared ChartList and DecisionPoint Chart Gallery
Price Momentum Oscillator (PMO)
Swenlin Trading Oscillators (STO-B and STO-V)
Technical Analysis is a windsock, not a crystal ball.
Happy Charting!
- Erin
**Don't miss DecisionPoint Commentary! Add your email below to be notified of new updates"**
