A wild week for the indexes concluded with a slam on Friday. As we head into earnings, we continue to see the market oscillate between the bulls and the bears.
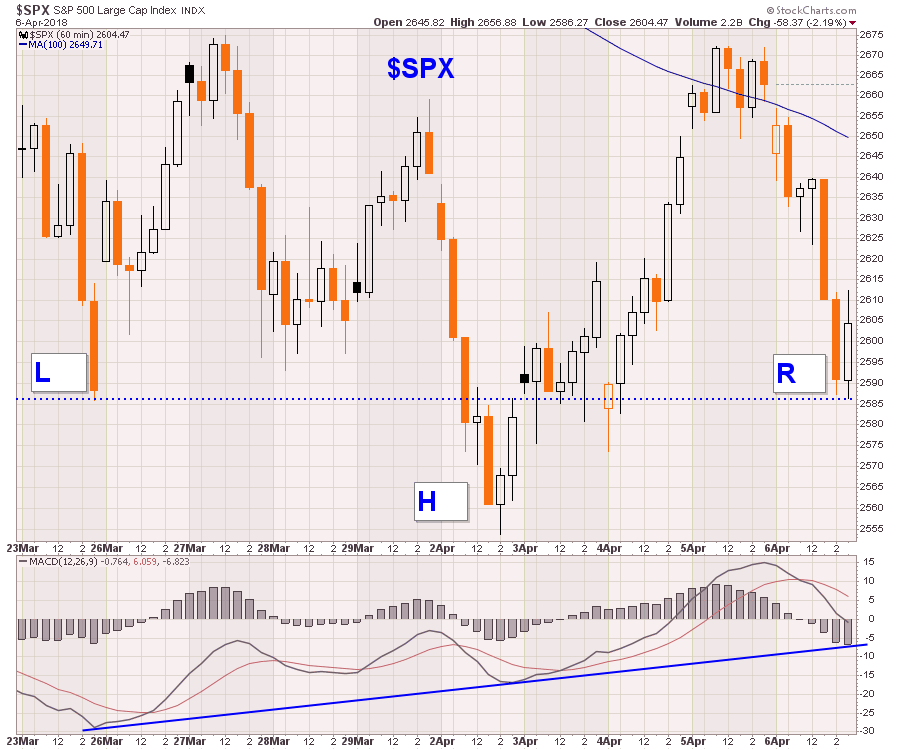
 I continue to see a couple of nice things in the wild swings. The upcoming week should tell us which way this is going. Here is a two week view of the $SPX with 60-minute bars.
If Friday is the low or near the low:
- We have a head shoulders base
- Left and right shoulders are equal here
- The improving momentum matches a head/shoulders base
 Zooming out we can see the market continually testing the February 9th lows. Monday will also be the 9th of the month. Notice the RSI and PPO making higher lows in support of the base building effort. However, we have not seen the positive cross on the PPO yet to confirm this right shoulder low is in. While there is a little room for lower on the PPO next week heading into earnings, we are about to find out if enough buyers are going to step in. The market stalled at the top on Thursday right at the level that would have made a higher weekly high at 2674. That also creates a neck line for the head/shoulders base.
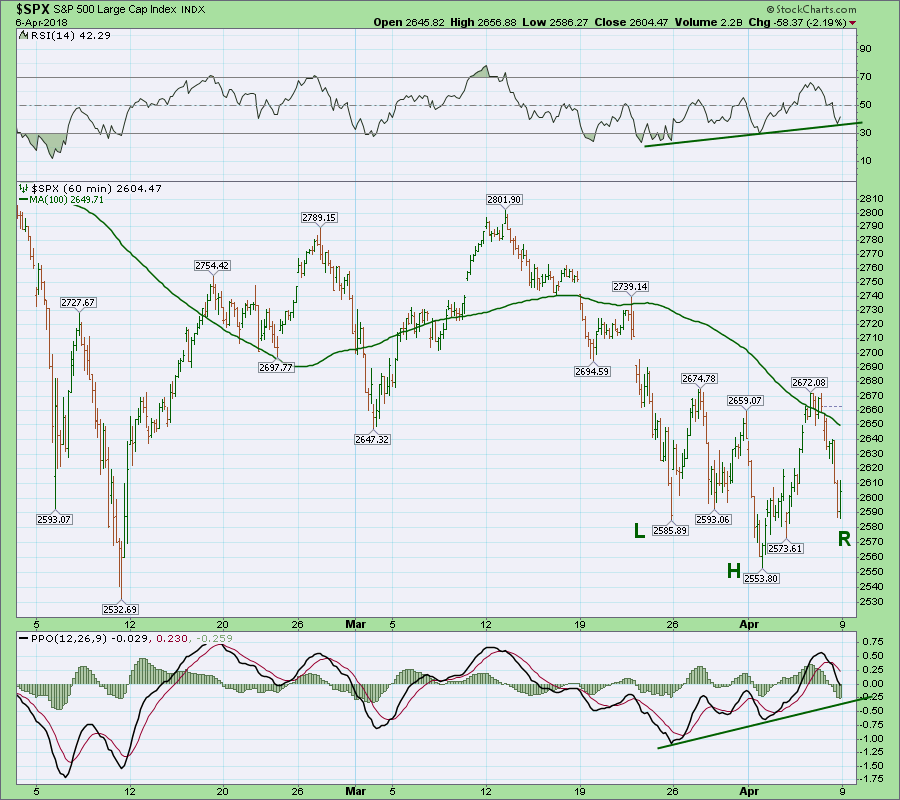 Lastly, in the book Stock Charts For Dummies, I mentioned that one of the big things to look for in market corrections are a final break of the lows and a whipsaw that starts the new rally. There are a few things to consider and this base example back in 2010 is worth reviewing.
This is a daily chart for 2010 but there are some great similarities. We consider markets fractal. Fractal means we can see similar patterns on different time frames.
Lets review some of the similarities:
There are 4 months that are earnings periods. January, April, July, October. The 2010 market topped at the end of April which was an earnings period. The market continued down until the first week of the next earnings period (July). Now in 2018 we have the market top on January 29th earnings period and now we are trying to rally in the first week of the next earnings period.
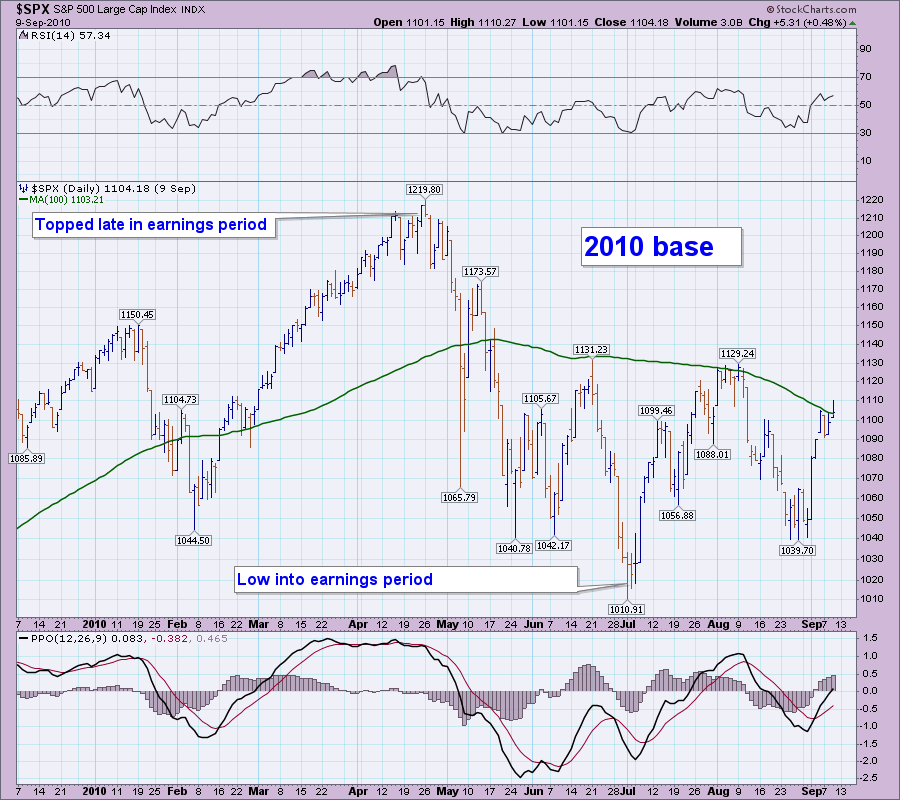 In 2010, the low broke below the three previous lows, dropped for two days and rallied almost straight up for a month. The higher momentum on the July low in 2010 was a great signal. On the 60 minute charts above we have higher lows in momentum. Currently we have a lower low on the setup on the daily chart (not shown) so thats concerning.
To conclude: Lows into earnings periods are not uncommon. Be wary of being too negative as short term momentum is improving. If support does break, that might be an even better buying opportunity to catch the next four week rally. With earnings starting next week, I am expecting the lows to hold. But that is why we watch the charts every day!
Good trading,
Greg Schnell, CMT, MFTA
