ChartWatchers June 16, 2018 at 02:03 PM
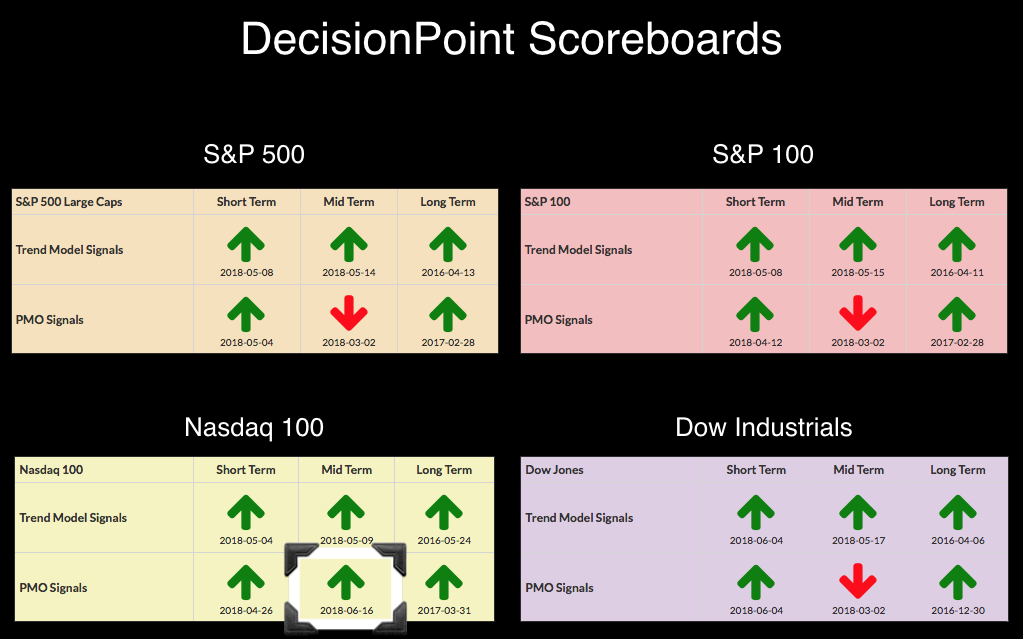
On Friday, the weekly charts went "final". With that finalization, the NDX which had been carrying a positive Price Momentum Oscillator (PMO) crossover throughout the week, finally posted the IT PMO BUY signal on its DP Scoreboard... Read More
ChartWatchers June 16, 2018 at 12:22 PM
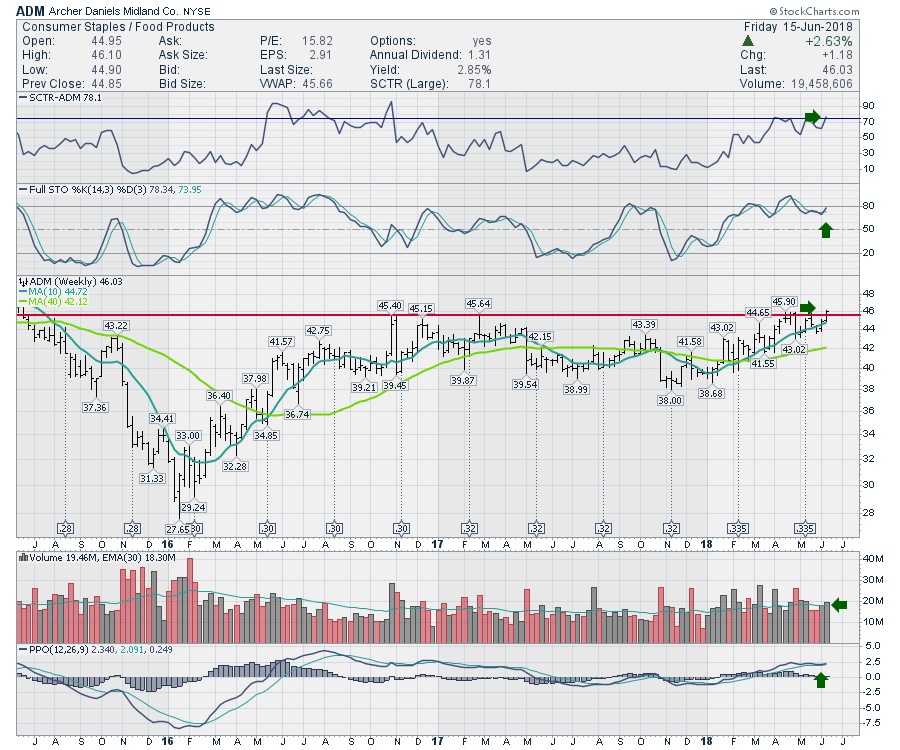
I ran some scans this morning looking for some new breakouts to 1-year highs. With the market pushing up for the last month, these food companies are starting to accelerate. First, Archer Daniels Midland is breaking out to new three year highs... Read More
ChartWatchers June 16, 2018 at 09:17 AM
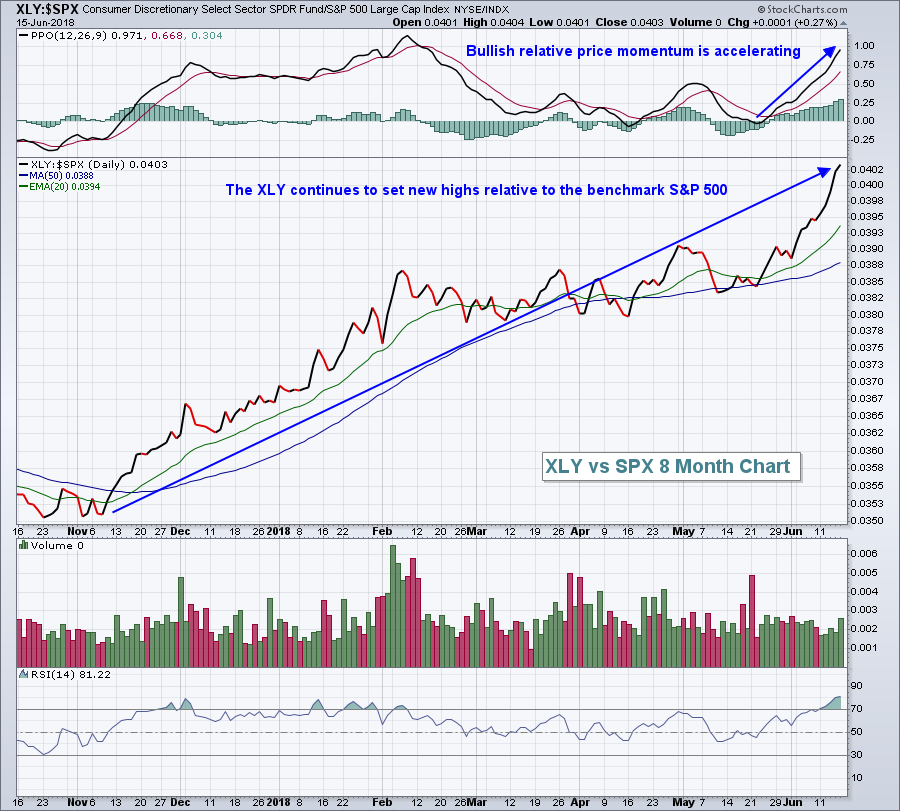
It seems simple enough. Buy stocks/ETFs that are outperforming the benchmark S&P 500. Well, that's part of it for sure. But it really goes a lot deeper than that. StockCharts.com provides you a myriad of ways to evaluate relative strength... Read More
ChartWatchers June 16, 2018 at 03:16 AM

The Industrials SPDR (XLI) has struggled in 2018 and is pretty much unchanged year-to-date. Despite flat performance this year, a pair of bullish continuation patterns are taking shape. Let's look at the key levels to watch going forward... Read More
ChartWatchers June 15, 2018 at 05:17 PM
Editors Note: This article was originally published in John Murphy's Market Message on Thursday, June 14th at 11:39am EST. The Fed raised its short-term rate by a quarter point yesterday as expected... Read More
ChartWatchers June 15, 2018 at 05:09 PM
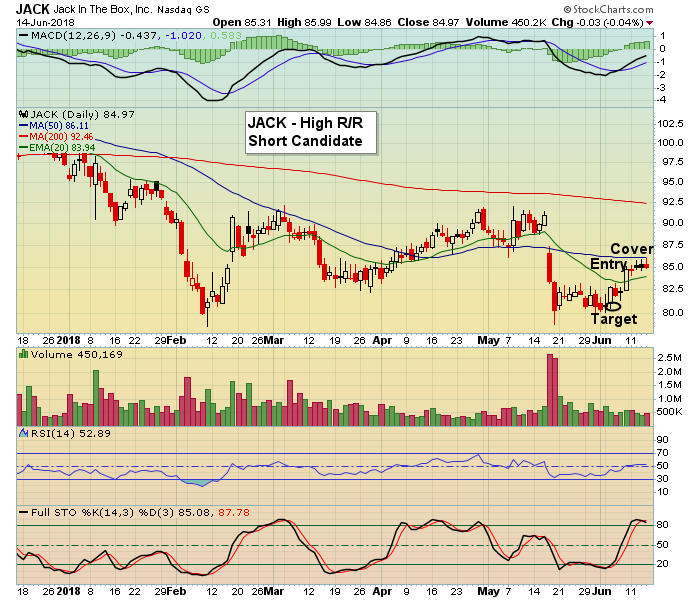
I have found over many years of trading that it is so much more difficult to make money shorting stocks than going long. With the exception of the Dot... Read More
ChartWatchers June 02, 2018 at 03:50 PM
Editors Note: This article was originally published in John Murphy's Market Message on Friday, June 1st at 1:19pm EST. A stronger than expected jobs report for May is giving a boost to stocks today... Read More
ChartWatchers June 02, 2018 at 03:46 PM
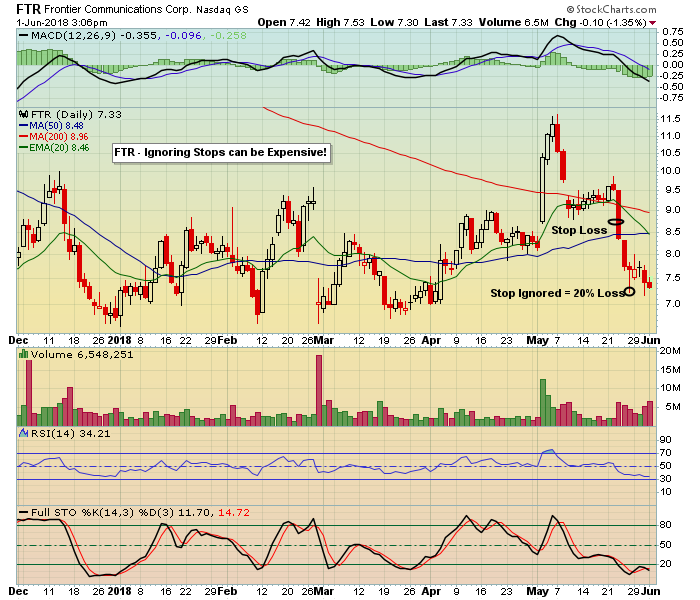
At EarningsBeats we issue long/short trade alerts on companies that beat/miss earnings expectations. When we issue a trade alert we include entry price, target price and stop loss. Stop losses are based upon key technical or price support, so they matter... Read More
ChartWatchers June 02, 2018 at 11:39 AM
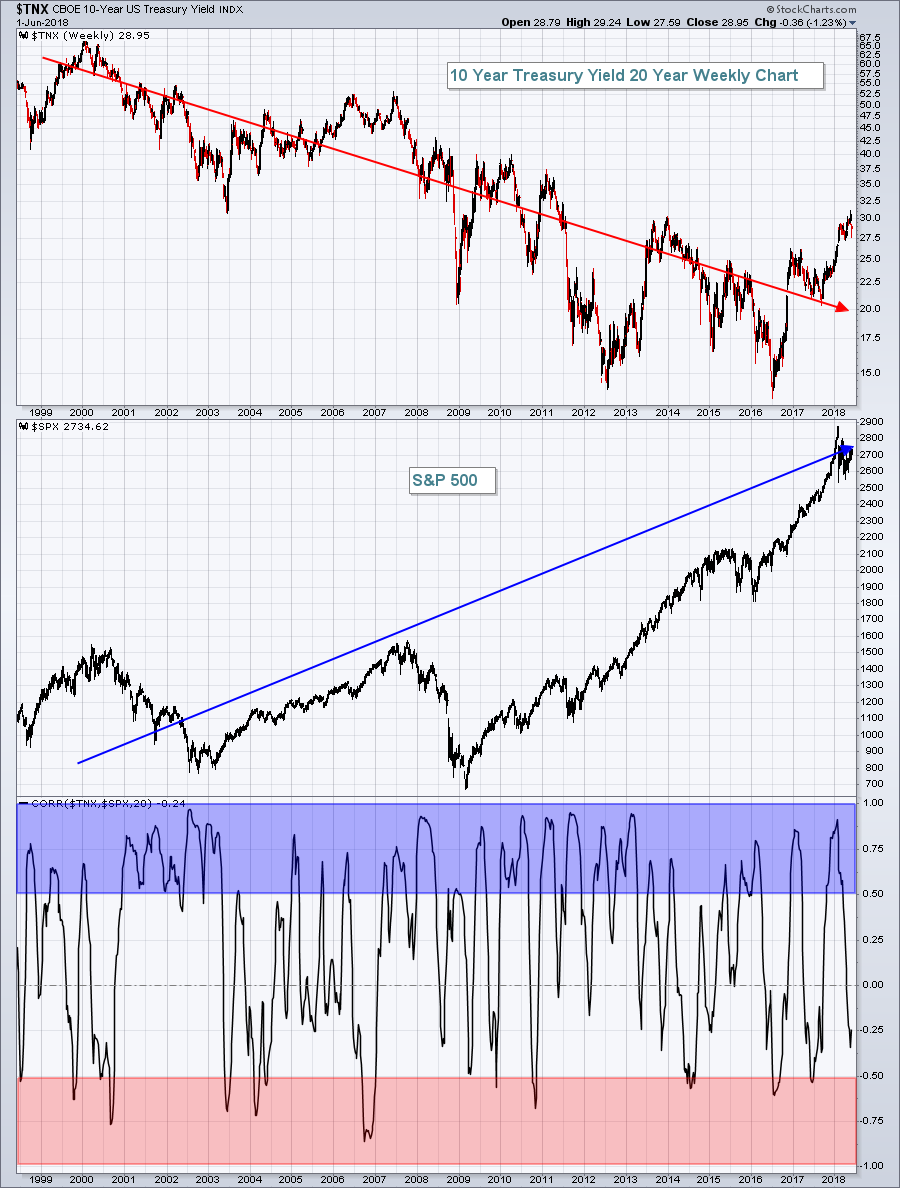
While many market pundits seemed to grow very concerned about the 10 year treasury yield ($TNX) rising to 7 year highs at its recent 3.11% peak, I only grow nervous when the TNX falls. Why? Well, rising rates are typically a precursor to economic strength... Read More
ChartWatchers June 02, 2018 at 09:27 AM

There were eight breadth thrusts in the month of May and seven of these were bullish (>70%). In particular, there were three bullish breadth thrusts last week. These strong readings show broad participation and give the bulls the edge going forward... Read More
ChartWatchers June 02, 2018 at 12:05 AM
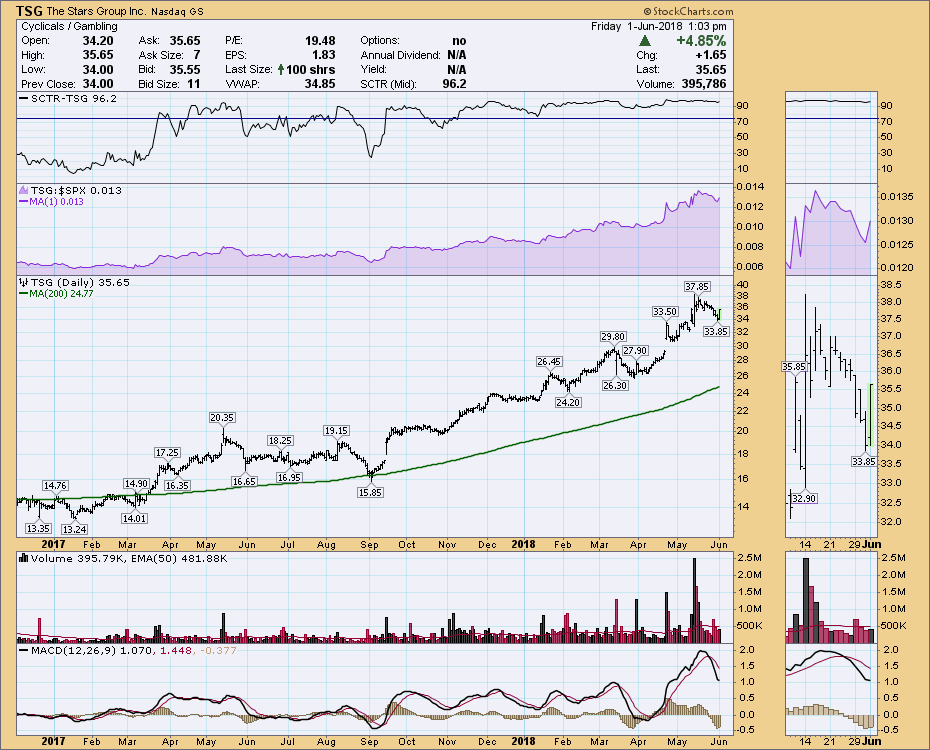
Three stocks in the online gaming arena are particularly interesting. With the changing regulations these three stocks are making big moves. You'll have to find your entry but they should be on watch lists. The Stars Group is listed in the USA and Canada... Read More
ChartWatchers June 01, 2018 at 06:25 PM
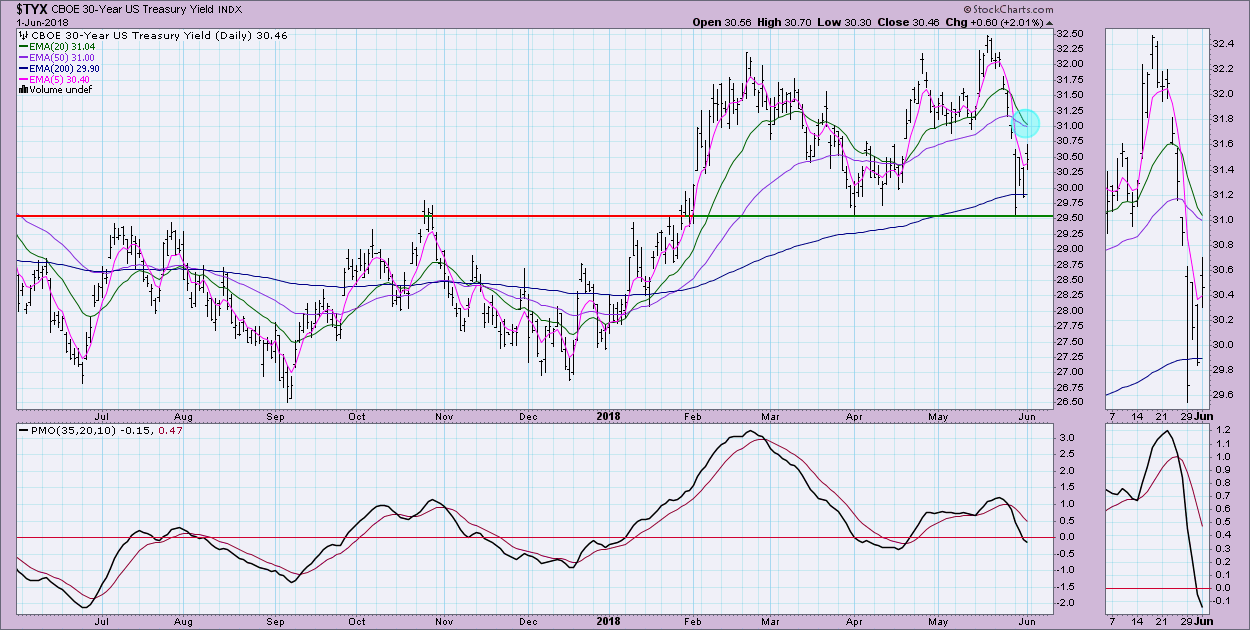
Bonds enjoyed quite a rally over the past two weeks which isn't a surprise given Bond Yields took a nose-dive. The daily chart of the $TYX shows how yields crashed. However, they are now bouncing off strong support at 2.95%... Read More