Editors Note: This article was originally published in John Murphy's Market Message on Friday, June 1st at 1:19pm EST.
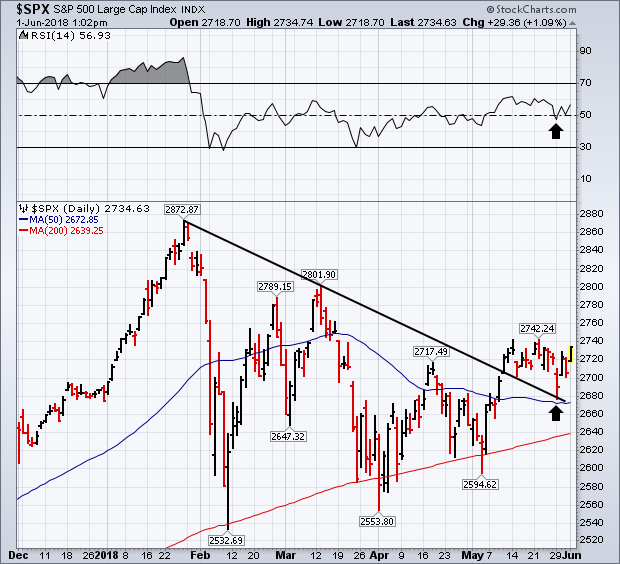
A stronger than expected jobs report for May is giving a boost to stocks today. So is the fact that European stocks are rising (as well as Italy's bond and stock markets). In addition, yesterday's stock selling in response to new tariffs was relatively mild which is also encouraging. The bottom line is that stocks are having a strong day today and are starting the month of June in a stronger technical condition. Chart 1 shows the S&P 500 ending the week on a strong note and on pace to challenge its May high near 2742. A close above that level would restore the market's uptrend. There are three other encouraging signs on Chart 1. One is the fact that Tuesday's Italy-inspired selloff bounced off its 50-day average. The second is that the SPX also bounced off the falling trendline drawn over its January/March highs. That resistance line was exceeded three week's ago to the upside. One of the rules of chart analysis is that a resistance line once broken on the upside should act as a support line on subsequent pullbacks. The black arrow shows it doing just that on Tuesday. The third positive sign is the ability of the 14-day RSI line (top box) to stay above the 50 level. That's usually a sign of rising momentum. Nine sectors are in the black today being led by technology. Consumer staples are lagging. Utilities are the day's biggest losers owing to a rebound in Treasury yields. Today's rebound in stocks is causing some selling of bonds and bond proxies. That also suggests that Tuesday's flight to safety into Treasuries may have run its course.