My expectation for week end was two new weekly PMO BUY signals. Instead we got only one. The SPX missed its weekly PMO BUY signal by hair or technically, by two one-hundredths of a point. The OEX managed to squeak its out and the Dow is finally seeing a possible weekly PMO bottom. The NDX is just sitting back and waiting for everyone to catch up. It's been on a weekly PMO BUY signal since mid-June.
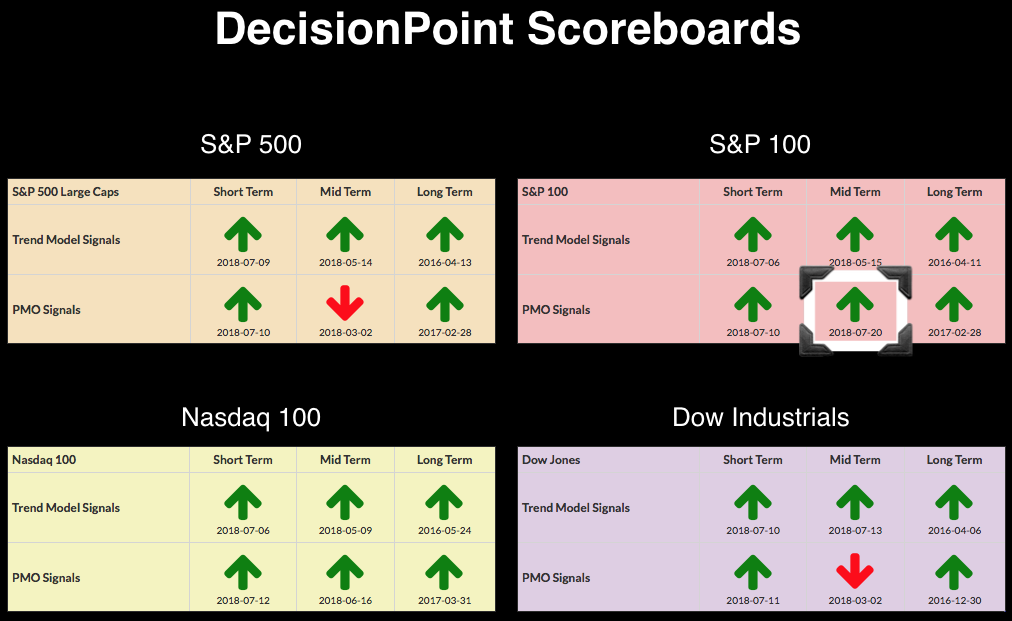
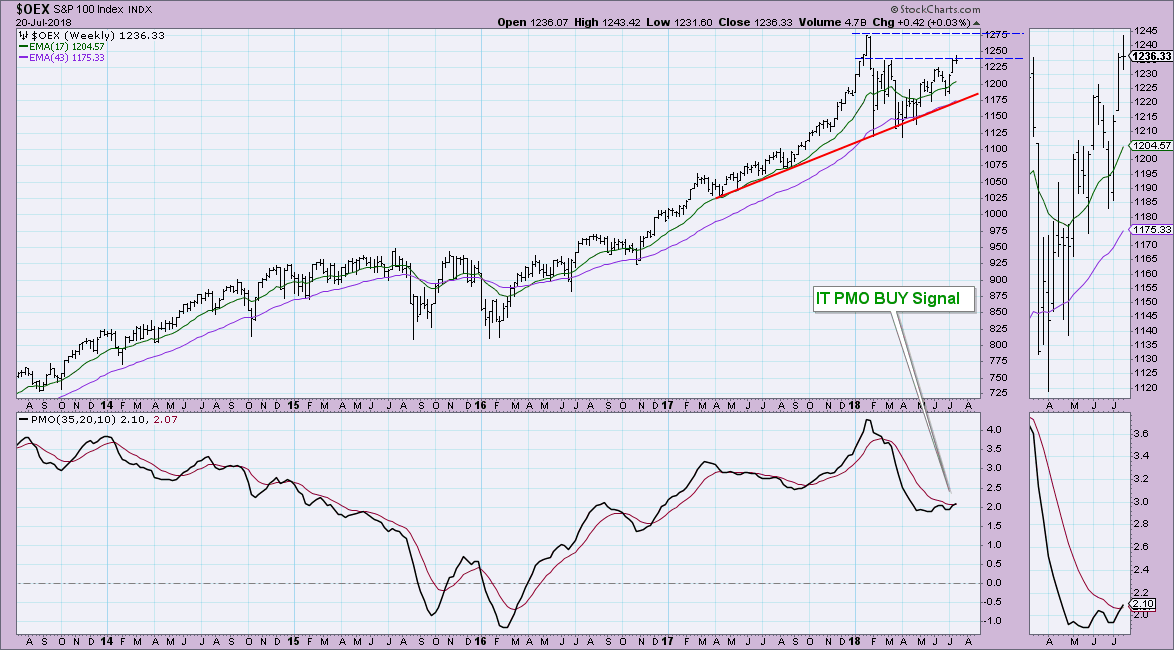
The OEX is attempting a breakout above resistance from the February/March top. It managed to hurdle the 2nd quarter top last week but pulled back slightly to close just about on top of it. The weekly PMO BUY signal was squeaked in by three one-hundredths of a point. I don't like seeing such a thin margin, but the breakout is encouraging. If we see just a little bit of follow-through, the signal should stick around.
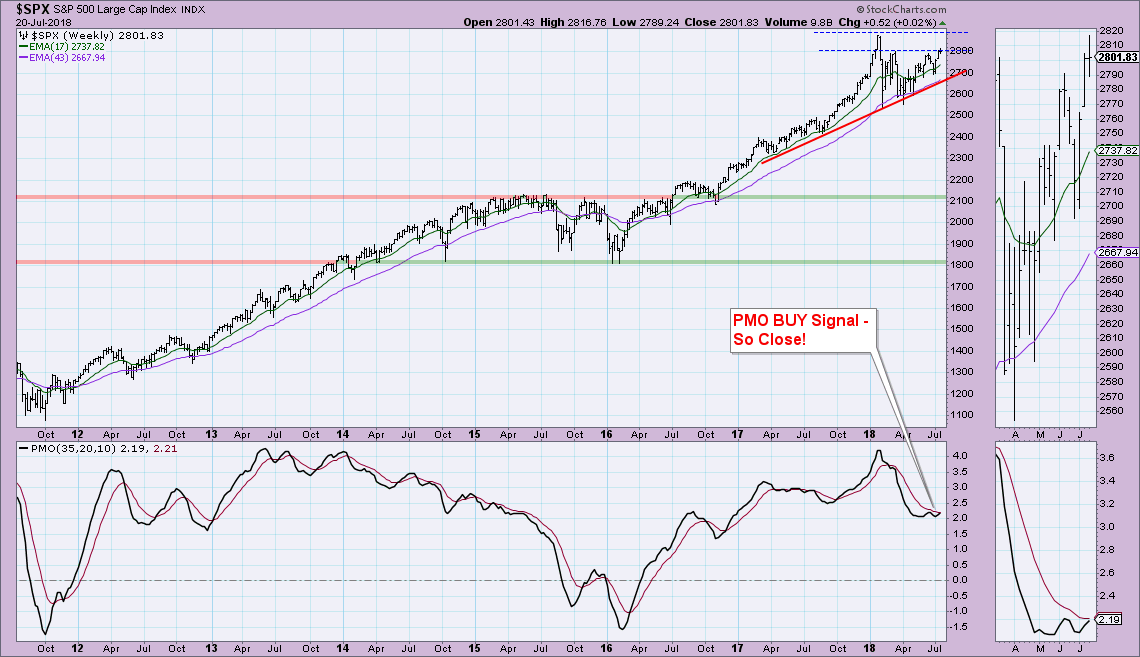
The SPX chart looks nearly identical except the PMO BUY signal just didn't quite trigger. We could see that new signal this Friday barring a pullback on the week. Admittedly when I looked at the sentiment charts on the MarketWatchers LIVE show yesterday, I did give my "prediction" that the SPX will close lower on the week and that would prevent that signal from triggering for another week.
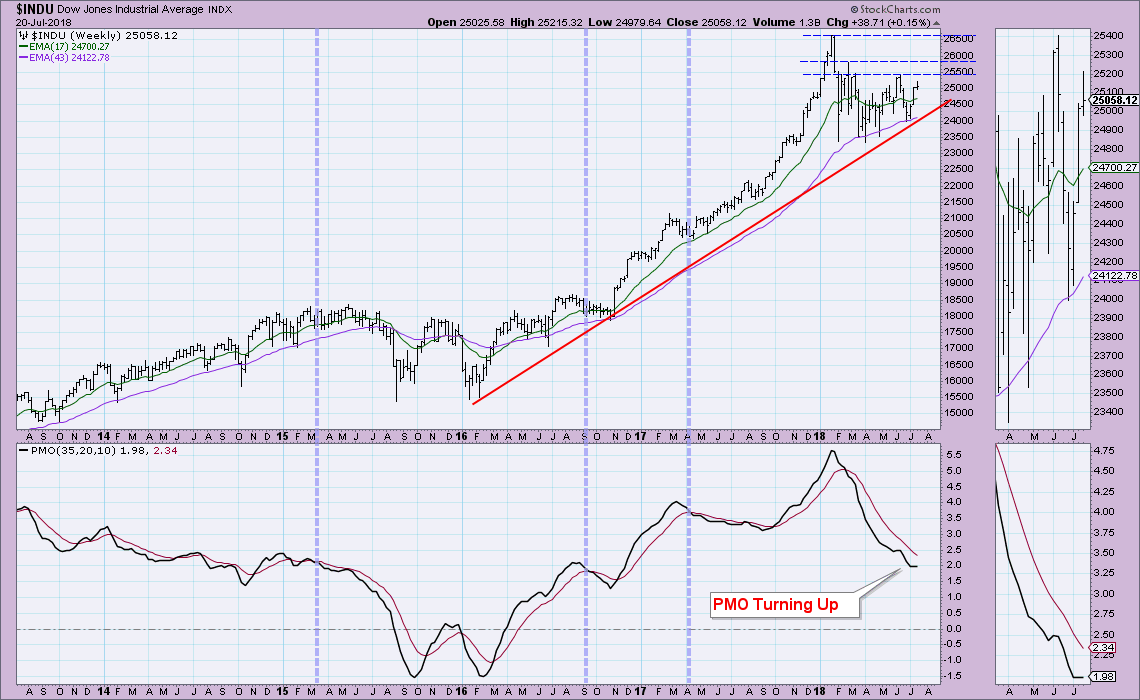
The Dow hasn't quite broken above the declining tops trendline and is not yet challenging the previous top last quarter. Given its weaker price action, it shouldn't be surprising to see a lackluster PMO. It has taken some time, but we do seem to have a weekly PMO that is decelerating and trying to put in a bottom.
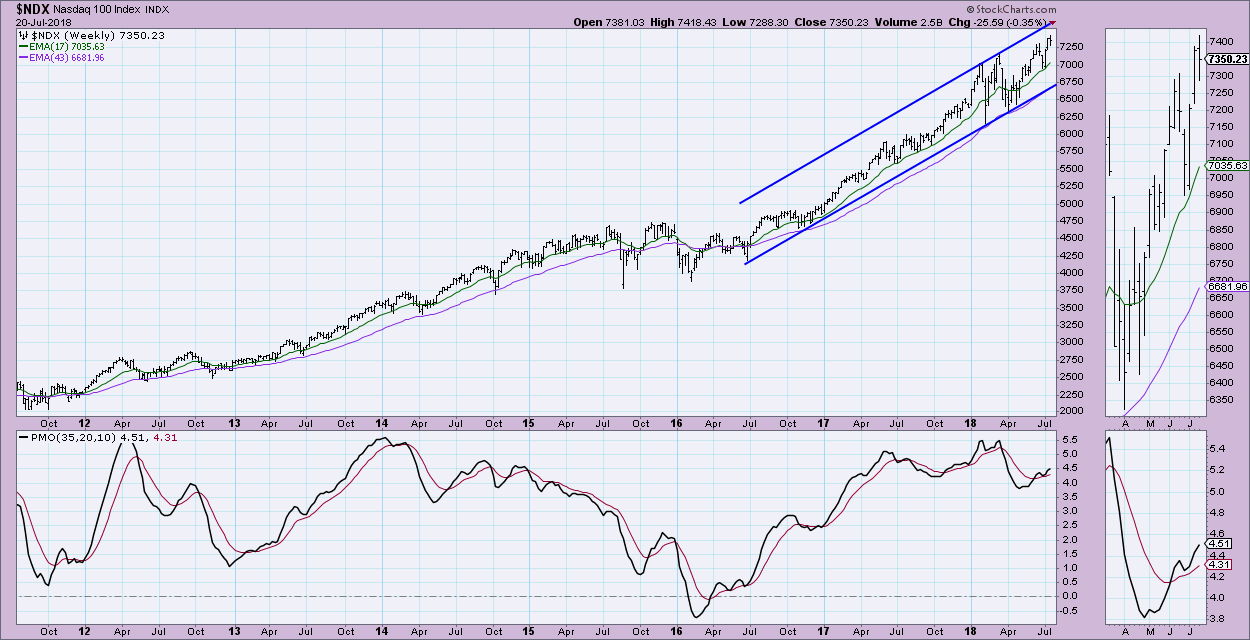
As you can see, the NDX is the strongest runner of the four Scoreboard indexes. It's enjoyed a weekly PMO BUY signal since mid-June. All-time highs have been reached the last two weeks suggesting healthy relative strength for technology. It managed to avoid a PMO SELL signal on the last pullback and does appear poised to test the top of the longer-term rising trend channel.
Conclusion: I am expecting a mostly flat trading week with a close that is .25% lower than this week. While this may seem counter-intuitive given the strong earnings that continue to be released, but trade talk and other thorny political issues seem to be weighing the market down. I wouldn't assume higher prices just based on the anticipation of strong earnings reports. There were plenty of strong earnings released last week and the market could only eek out a .02% gain.
Technical Analysis is a windsock, not a crystal ball.
Happy Charting!
- Erin
Helpful DecisionPoint Links:
DecisionPoint Shared ChartList and DecisionPoint Chart Gallery
Price Momentum Oscillator (PMO)
Swenlin Trading Oscillators (STO-B and STO-V)
**Don't miss DecisionPoint Commentary! Add your email below to be notified of new updates"**
