It's widely known that September historically has been a difficult month for U.S. equities. Since 1950, the S&P 500 has risen during the month of September 30 times and moved lower 38 times. It's the only calendar month where the bears have had long-term success. The September annualized return of -5.58% is one of only two calendar months with negative annualized returns. The other is August, which has produced annualized returns of -1.04%. There are several well-known, large cap companies that have bullish track records in September. Here are three to consider:
Nike, Inc. (NKE):
NKE rises, on average, three out of every four Septembers and has gained an average of 6.0% during September over the past 20 years. Technically, NKE looks solid and recently reported both revenues and EPS that exceeded Wall Street consensus estimates:
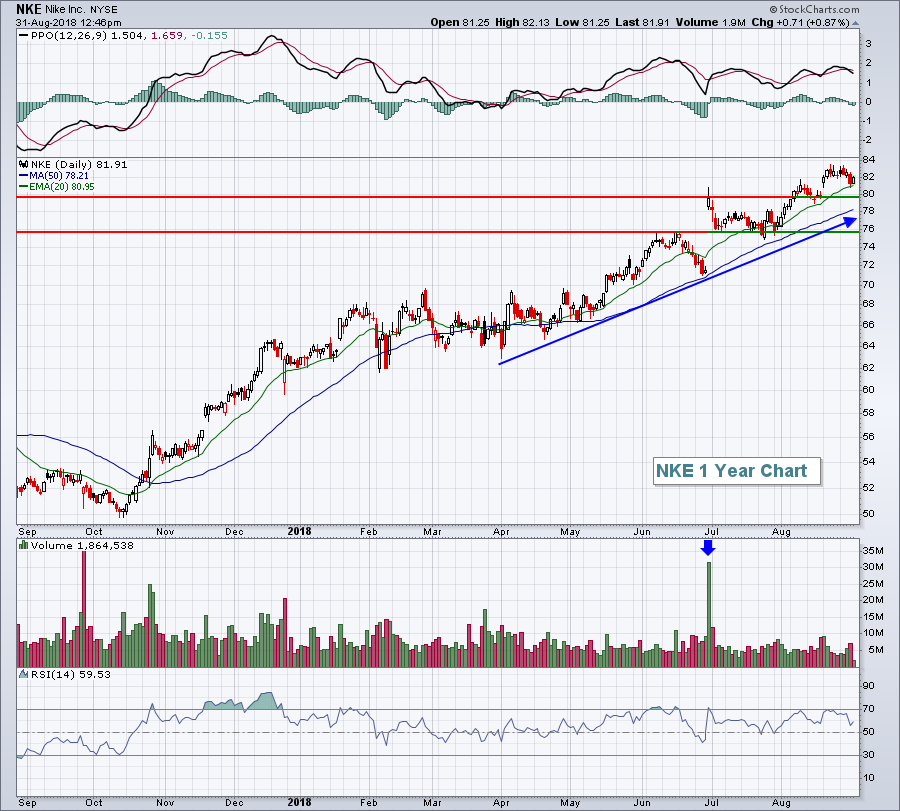 The 20 day EMA has been a solid entry level recently and NKE is currently trading near that key moving average. Technically, it appears that NKE is a good position to keep its bullish September track record intact.
CME Group, Inc. (CME):
CME is in a very bullish pattern that, if confirmed with a breakout, looks to push higher. Historically, September has been the best calendar month of the year for CME, with average September gains of 6.1% over the past 20 years. Technically, here's what to look for on CME:
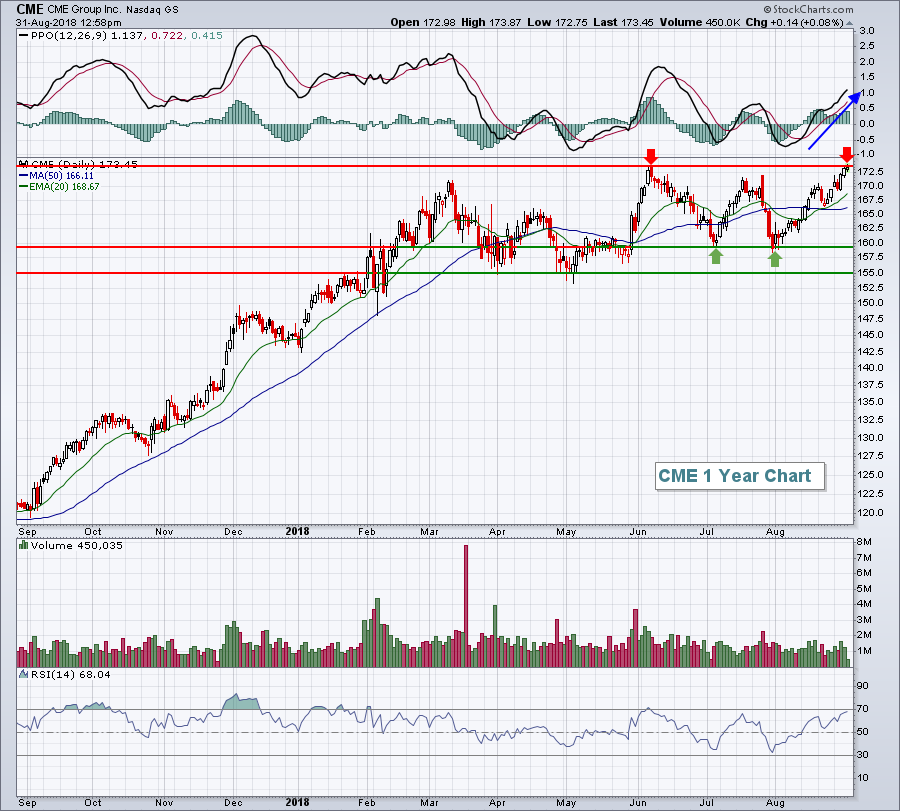 I'd look for either a confirmed heavy volume breakout above the 174 level on a closing basis or a pullback to test the rising 20 day EMA, currently near 169. The PPO is quite strong, suggesting that a breakout is likely only a matter of time.
Alphabet, Inc. (GOOGL):
GOOGL loves the months of September and October, where the stock has gained an average of +5.4% and +11.7%, respectively, over the past 15 years. Perhaps the best news is that GOOGL appears to be printing the inverse right shoulder in a bullish inverse head & shoulders continuation pattern:
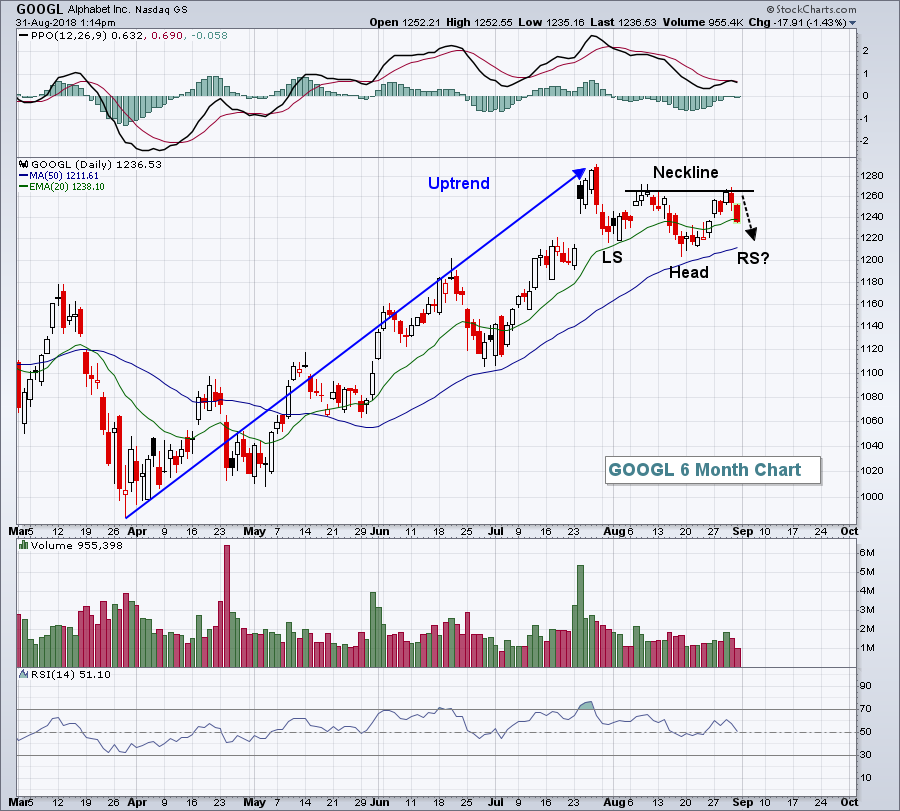 Ultimately, a breakout above neckline resistance near 1270 would measure to 1340, a level we could see during GOOGL's bullish September-October time frame.
Happy trading!
Tom
