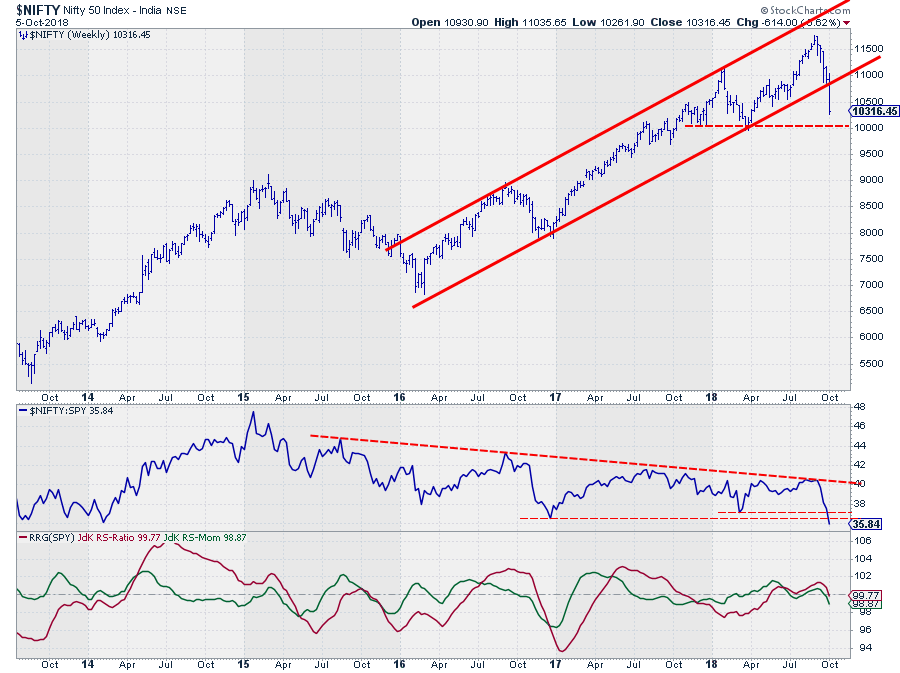
 The Indian $NIFTY Index dropped out of an almost three-year uptrend at the close of last week. The rising support line that started at the low in early 2016 did not manage to hold up and was clearly broken during last week's market action.
This move changes the dynamics of the Indian stock market. On the weekly chart above a new series of lower highs and lower lows has not (yet) begun. So technically it is not a downtrend yet. On the daily chart, however, a series of lower highs and lower lows is visible already since the first week of September.
Relative Rotation Graphs can help to put the move of the $NIFTY index in international perspective as well as help pinpoint sectors within the $NIFTY index that should offer protection against a decline of the general market, or at least an outperformance over $NIFTY.
From an international perspective
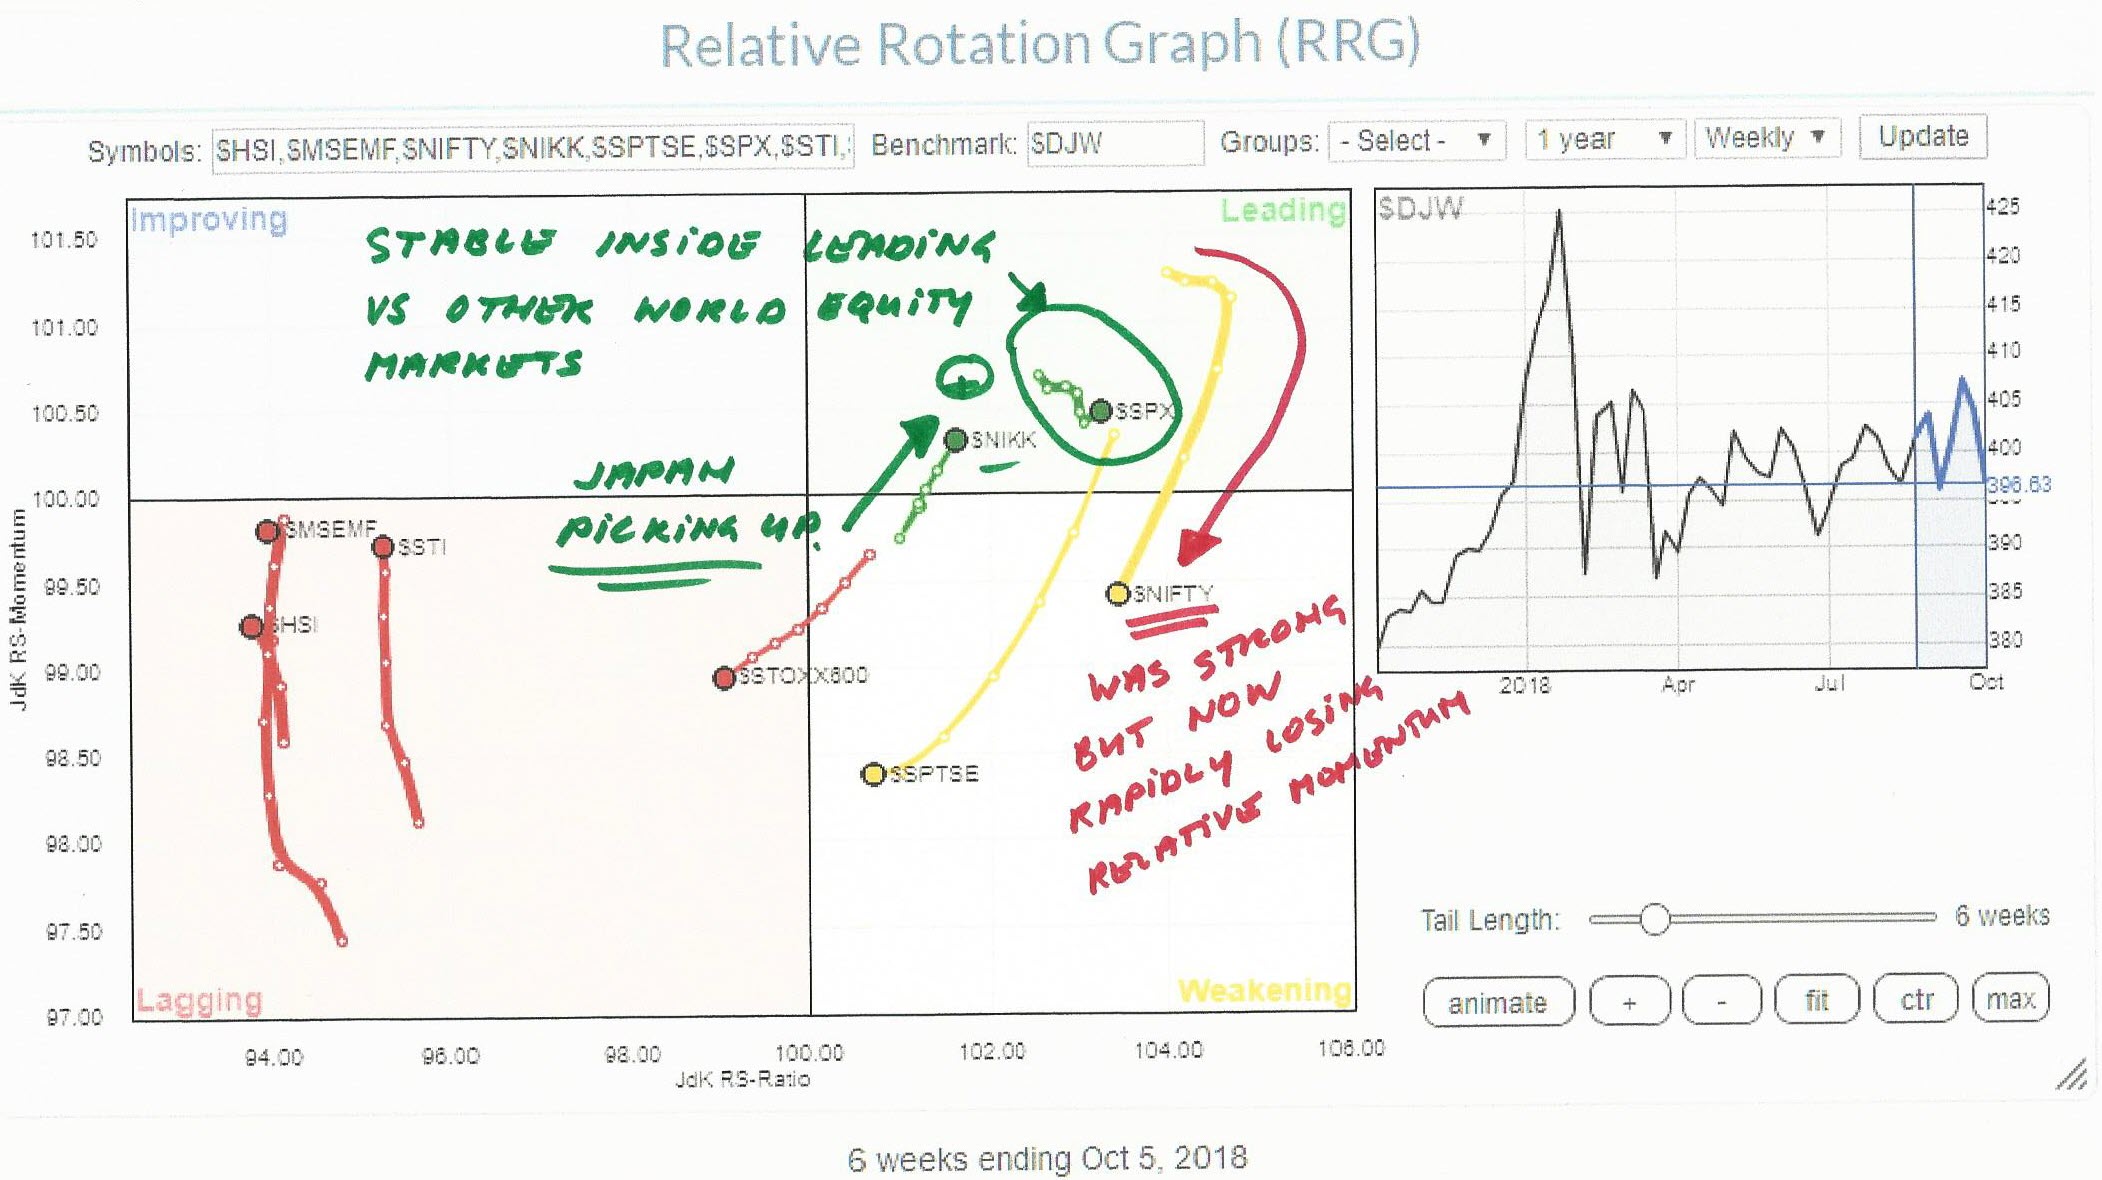 The Relative Rotation Graph shows the $NIFTY inside the weakening quadrant, which it entered a few weeks ago after a strong rotation through leading. The long tail indicates that there is (negative-) power behind this rotation.
The US market ($SPX) is still stable, indicated by the short tail, inside the leading quadrant making it one of, if not "the", strongest equity market in the world (at least in this selection of world markets).
The Japanese $NIKK index is making an interesting move as it rapidly rotated back to leading after a short move through weakening, looks like an interesting market to have a look at (in another post).
Where to go?
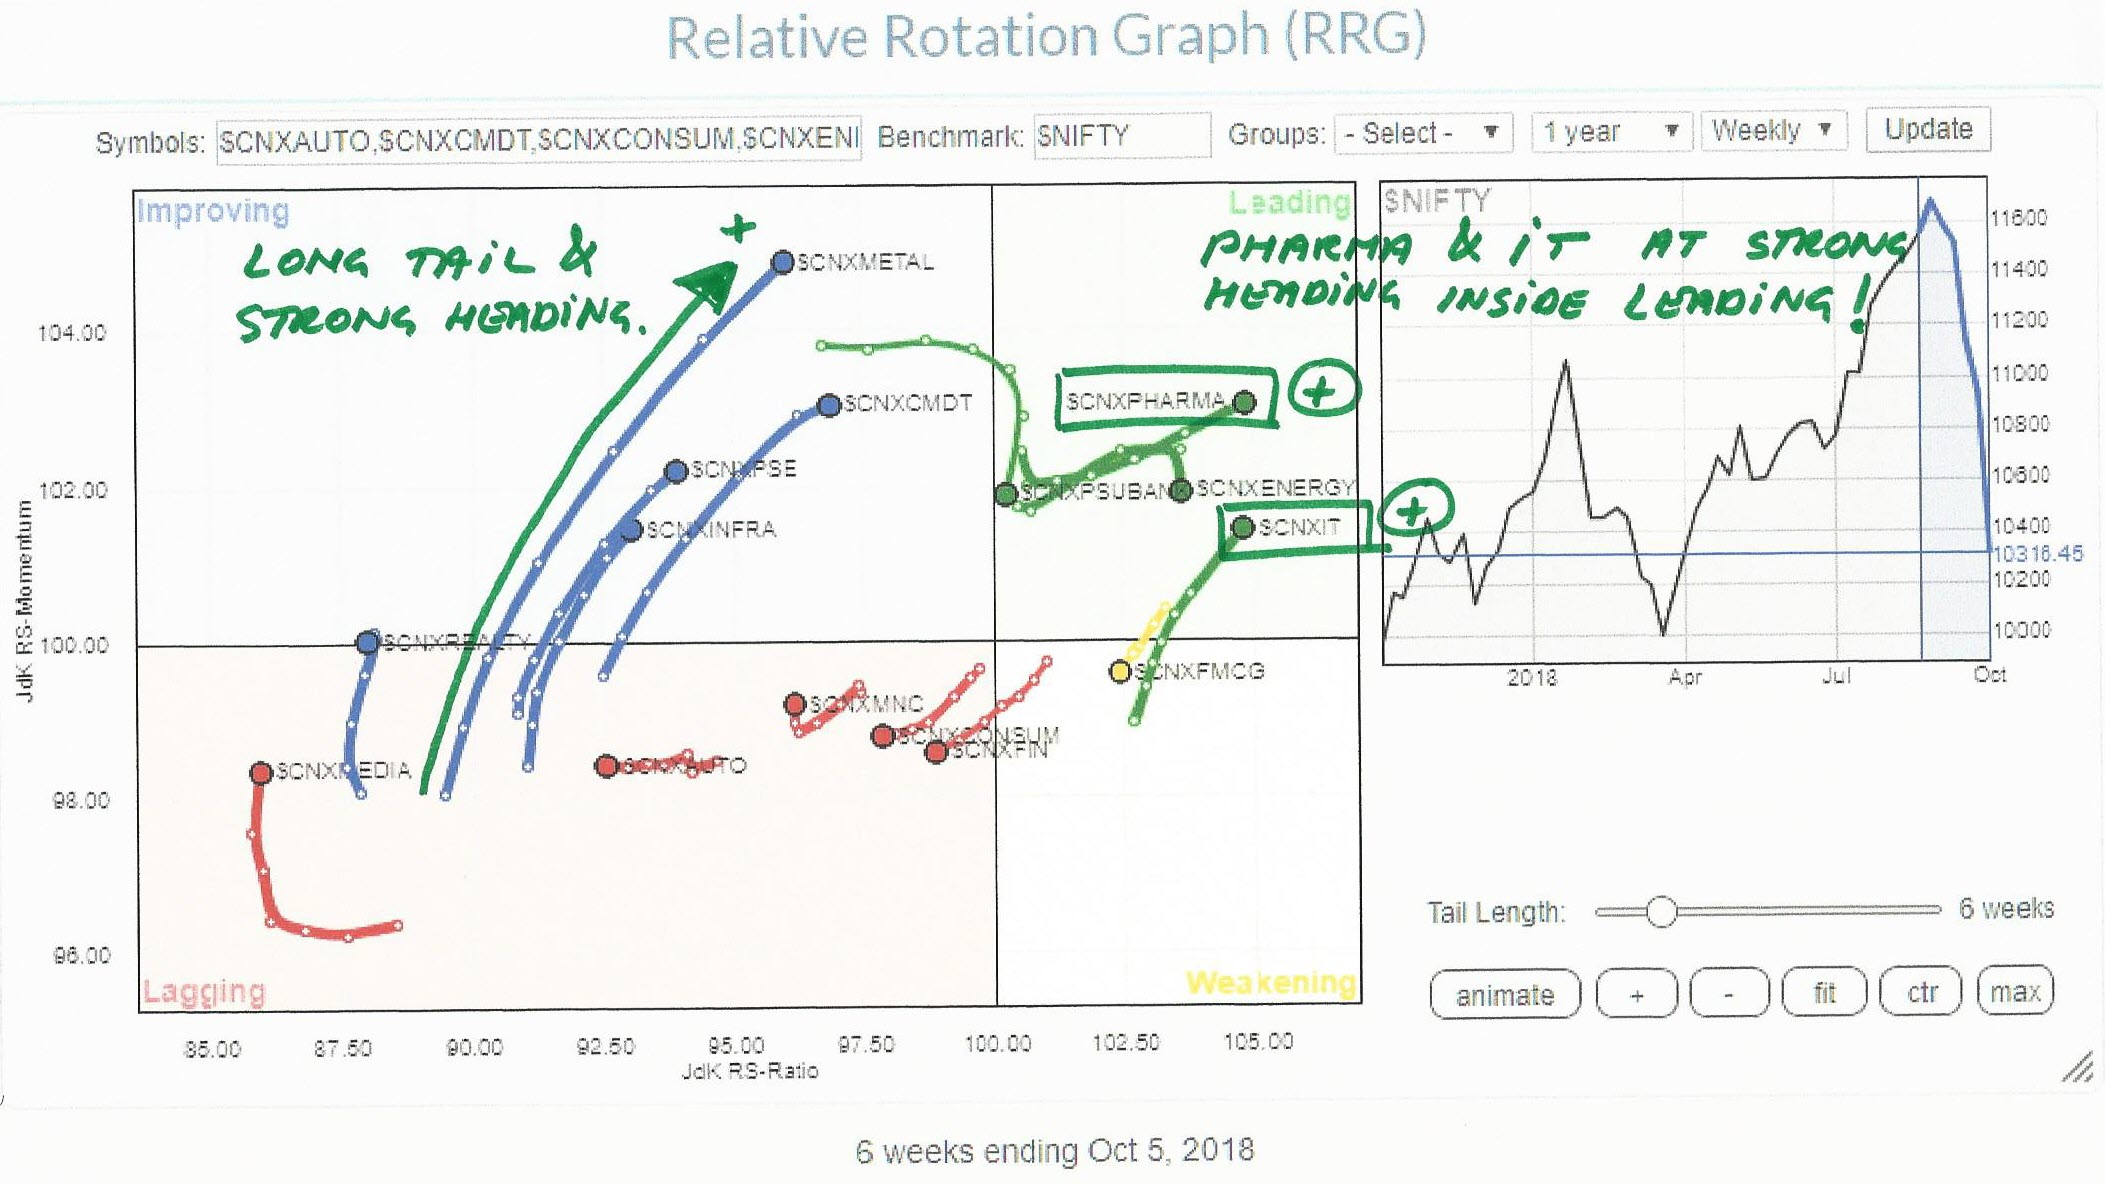 With the NIFTY stumbling down, the Relative Rotation Graph for Indian sectors can provide us with some perspective of sectors that may offer investors some protection against a general decline or at least outperform the benchmark index.
Inside the leading quadrant, there are four sectors; Pharma, Banks, Energy and IT. Of those four, Banks and Energy have already started to roll over and they are moving lower on the JdK RS-Momentum scale. This makes them less interesting as they may have already run their course.
Pharma and IT are inside the leading quadrant AND at a strong, which means between 0-90 degrees, RRG-Heading. This makes these two sectors the leading sectors for the Indian market at the moment.
A third sector that may be worth keeping an eye on is the Metal sector which is inside the improving quadrant but showing a very long (=strong) tail, is at the highest Jdk RS-Momentum value AND heading towards the leading quadrant at an almost 45-degree angle.
I will expand on this analysis in my RRG-blog in coming days.
My regular blog is the RRG blog If you would like to receive a notification when a new article is published there, simply "Subscribe" with your email address using the form below.
Julius de Kempenaer | RRG Research
RRG, Relative Rotation Graphs, JdK RS-Ratio, and JdK RS-Momentum are registered TradeMarks ®; of RRG Research
Follow RRG Research on social media:
Feedback, comments or questions are welcome at Juliusdk@stockcharts.com. I cannot promise to respond to each and every message but I will certainly read them and where reasonably possible use the feedback and comments or answer questions.
If you want to discuss RRG with me on SCAN, please use my handle Julius_RRG so that I will get a notification.
