Charts of fundamental data are as useful as price charts in helping us visualize fundamental context and trends. In the case of earnings, the following chart shows us where the S&P 500 would have to be in order to have an overvalued P/E of 20 (red line); fairly valued P/E of 15 (blue line), or an undervalued P/E of 10 (green line). I have added three hash marks on the right side of the chart to show where the range markers are projected be at the end of 2019 Q2. Currently, price is well above the traditional value range; however, assuming no major price advance or decline, and assuming that earnings projections are relatively accurate, price will be back within the normal range next year. Even so, the market will still be at the high side of the range and, therefore, overvalued.
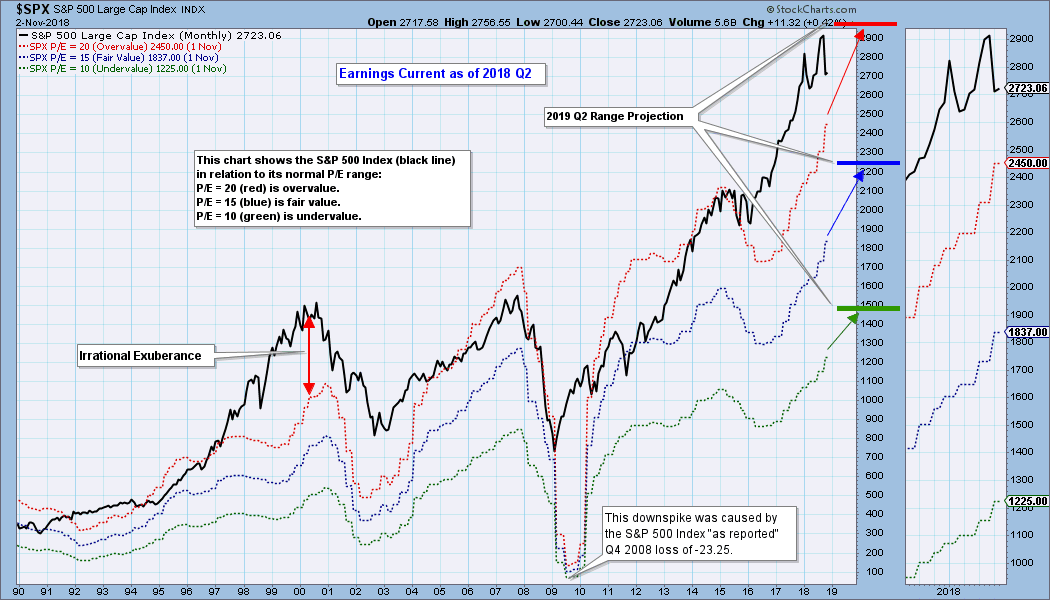
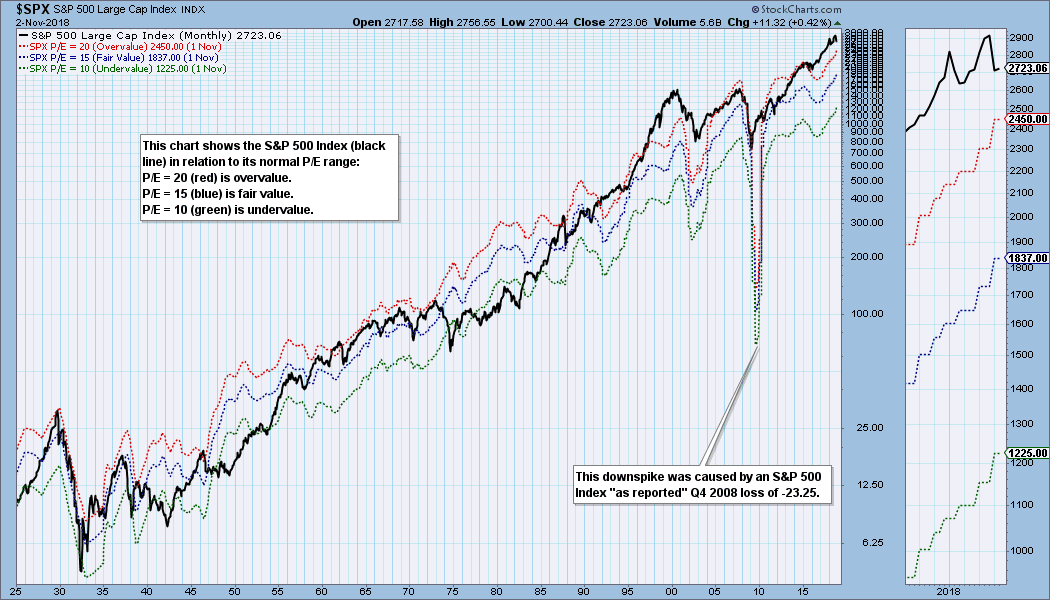
For over 90 years of market history price has usually stayed below the top of the value range (red line); however, since about 1998 it is more common for price to exceed normal overvalue levels. The market hasn't been undervalued since 1984.
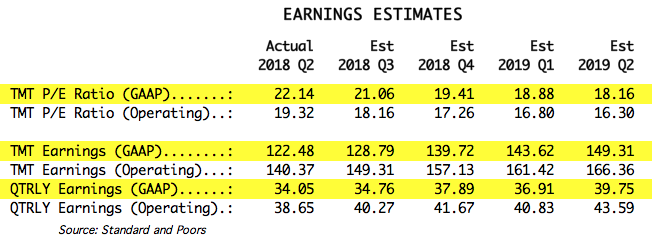
The table below shows how earnings are expected to improve going forward, but the drop in P/E shown is only possible if price doesn't change significantly, which, of course, probably won't be the case. And in the best case shown (2019 Q2), the market will still be very overvalued.
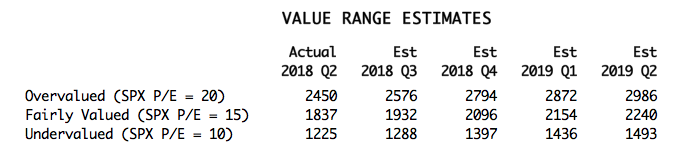
The following table shows where the colored bands will be as earnings improve.
CONCLUSION: The S&P 500 is well above the normal value range and is extremely overvalued. Historically, overvalued conditions leave the market vulnerable for a large correction or bear market. The current conditions are not a signal for immediate action, rather, it is part of the context in which we should view the market during the process of making decisions. So let's keep in mind that valuations are working against us.
Technical Analysis is a windsock, not a crystal ball.
Happy Charting!
- Carl
NOTE: The signal status reported herein is based upon mechanical trading model signals, specifically, the DecisionPoint Trend Model. They define the implied bias of the price index based upon moving average relationships, but they do not necessarily call for a specific action. They are information flags that should prompt chart review. Further, they do not call for continuous buying or selling during the life of the signal. For example, a BUY signal will probably (but not necessarily) return the best results if action is taken soon after the signal is generated. Additional opportunities for buying may be found as price zigzags higher, but the trader must look for optimum entry points. Conversely, exit points to preserve gains (or minimize losses) may be evident before the model mechanically closes the signal.
Helpful DecisionPoint Links:
DecisionPoint Shared ChartList and DecisionPoint Chart Gallery
Price Momentum Oscillator (PMO)
Swenlin Trading Oscillators (STO-B and STO-V)
