ChartWatchers February 16, 2019 at 03:58 PM
One of the hurdles to being a great market analyst is understanding the shifting sands of the stock market without an end point. In a baseball game, momentum may swing to and fro, but the game has an ending, based on innings and score, that defines when the game is over... Read More
ChartWatchers February 16, 2019 at 01:26 PM
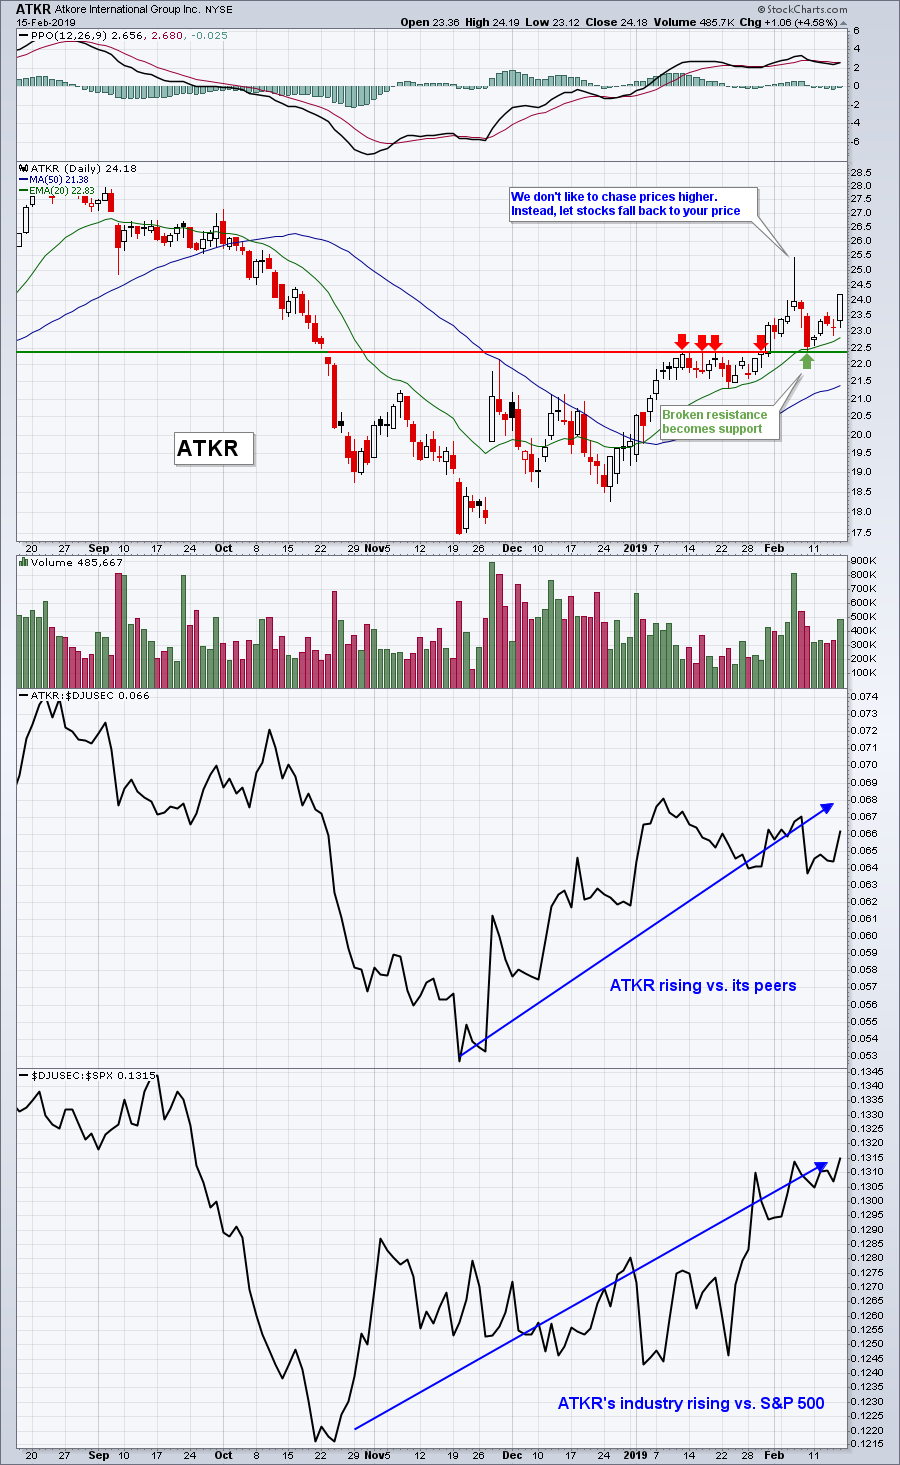
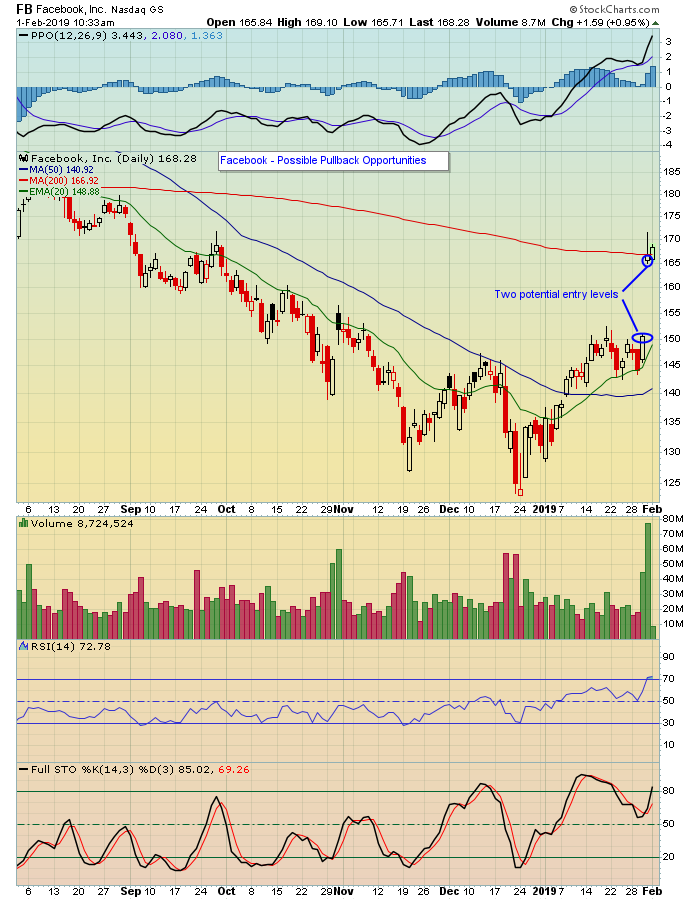
Well, it's really not a secret, but it's our secret at EarningsBeats.com. Our mantra is "Better Timing. Better Trades." and, for us, that means finding the best stocks, identifying key price and moving average support and then adding.....an extra helping of patience... Read More
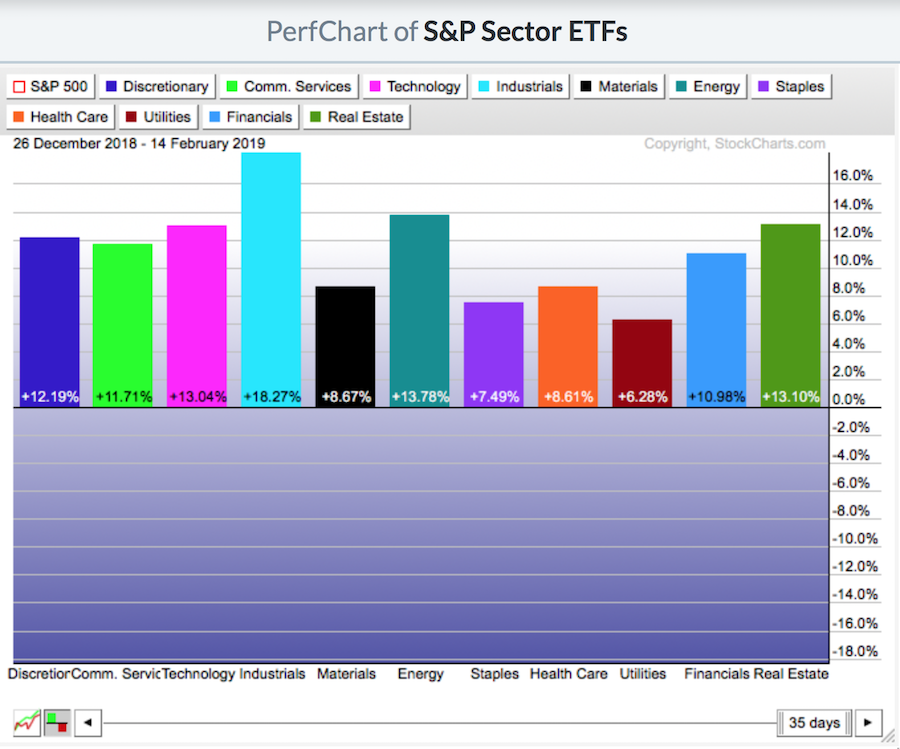
ChartWatchers February 16, 2019 at 11:05 AM
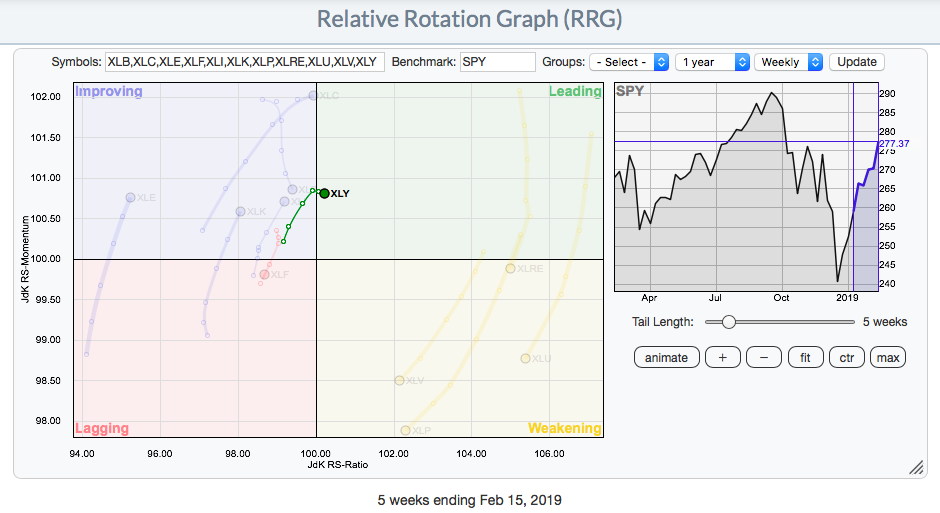
Understanding relative strength is extremely important in outperforming the benchmark S&P 500. As a sector begins to outperform, it tells us that money is rotating towards that particular sector. One way to visualize this is to look at an RRG chart... Read More
ChartWatchers February 16, 2019 at 07:05 AM
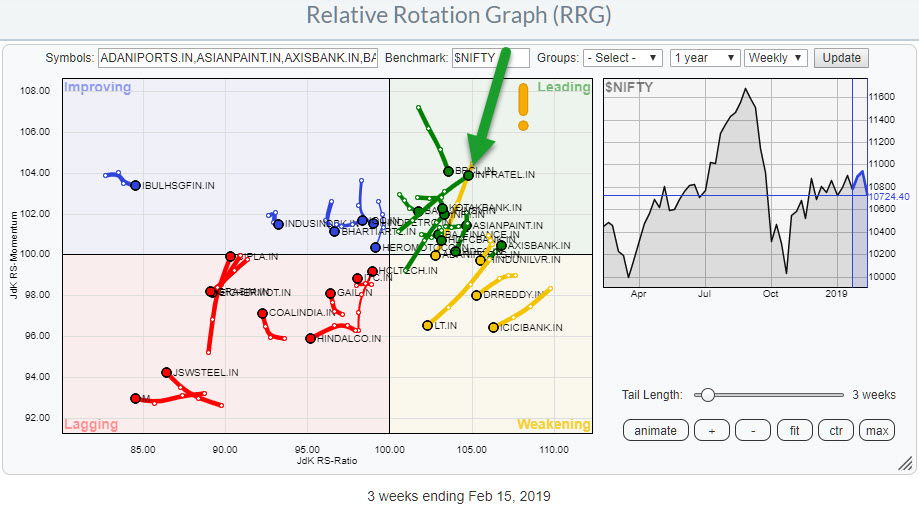
With more and more eyeballs looking at the Indian stock market and data for individual stocks and sectors becoming available on Stockcharts.com I started to keep an eye on developments in that market via Relative Rotation Graphs... Read More
ChartWatchers February 16, 2019 at 06:02 AM
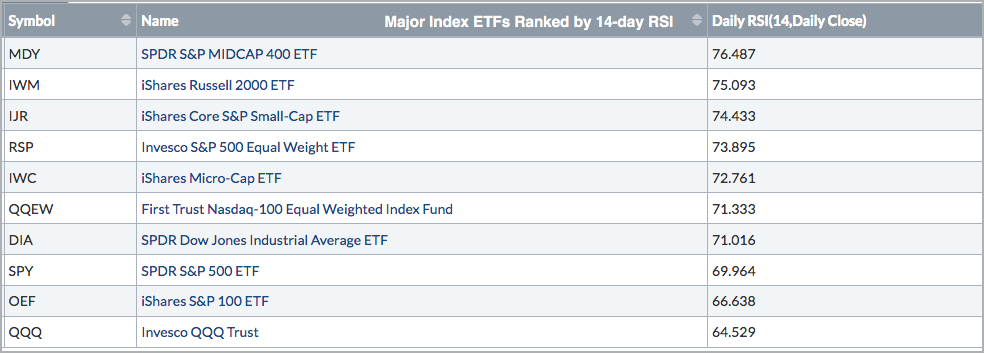
The Relative Strength Index (RSI) is a momentum indicator that chartists can use to measure the strength behind a price move. Moreover, chartists can also use RSI values to rank momentum and find the leaders... Read More
ChartWatchers February 16, 2019 at 12:00 AM
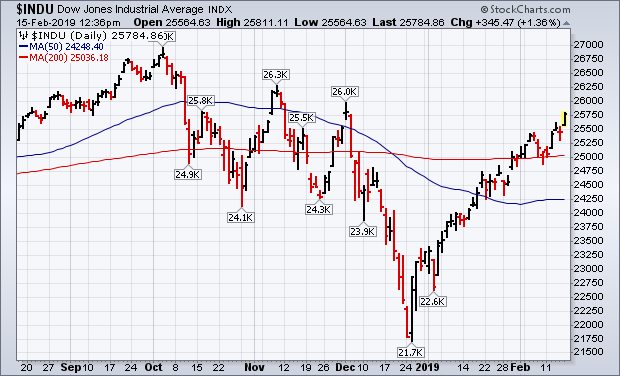
Editor's Note: This article was originally published in John Murphy's Market Message on Friday, February 15th at 12:40pm ET. Charts 1 and 2 show the Dow Industrials and S&P 500 building on their gains after rising above their 200-day averages (red lines)... Read More
ChartWatchers February 16, 2019 at 12:00 AM
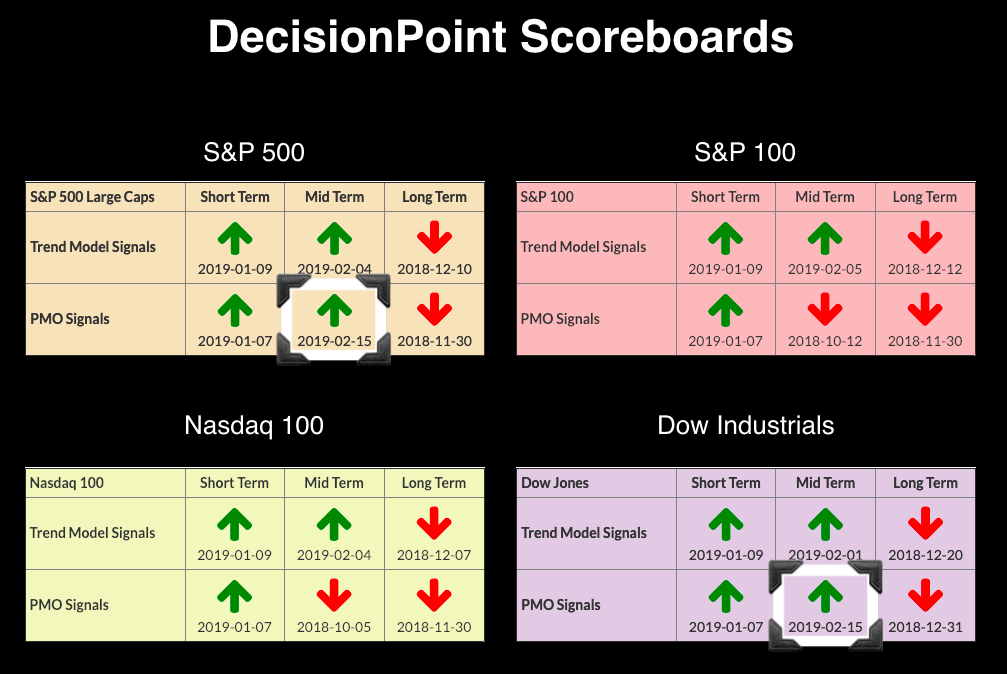
During today's DecisionPoint show on StockCharts TV (airing Fridays at 4:30p EST), Carl and I discussed how, while we're still bearish, there are signs of improvement. The main problem will be getting too overbought... Read More
ChartWatchers February 02, 2019 at 08:06 AM
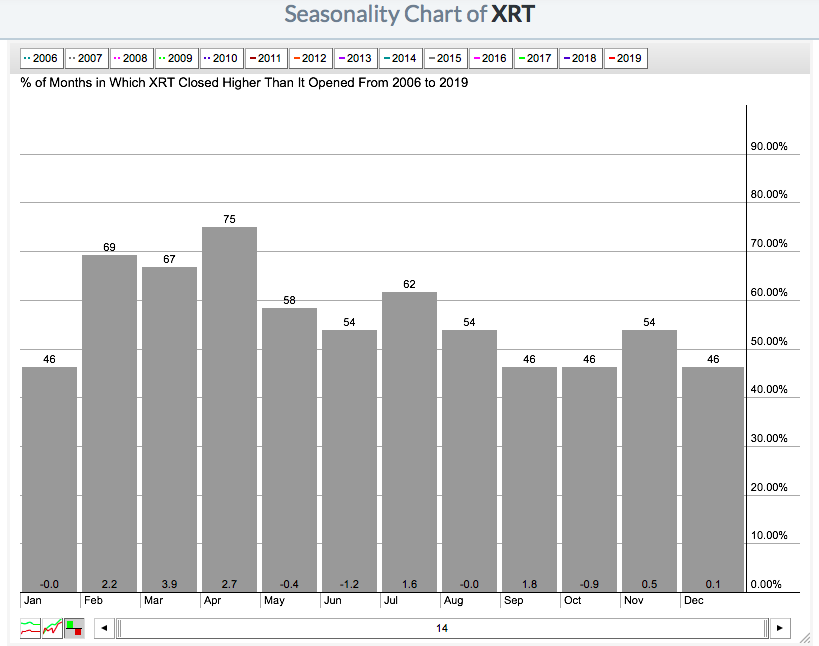
I love the seasonality tool here at StockCharts.com. It can potentially give you an advance notification of a price move before it happens... Read More
ChartWatchers February 02, 2019 at 08:05 AM
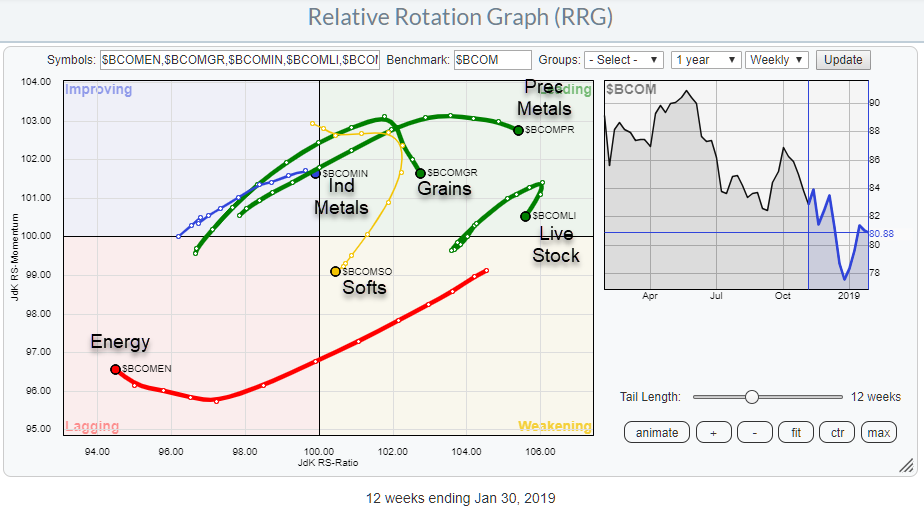
This article was published in the RRG blog on 31 January and takes a look at the Bloomberg Commodity Index Groups through the lens of a Relative Rotation Graph. When possible, I prefer to use data-sets that come from the same family and creating a "closed universe... Read More
ChartWatchers February 02, 2019 at 05:04 AM

One's outlook often depends on one's timeframe. This outlook can also be influenced by recent price action or a recency bias. The S&P 500 surged 7.87% in January and recorded its biggest monthly advance since October 2015. This surge, however, was preceded by a deeper 9... Read More
ChartWatchers February 02, 2019 at 12:00 AM
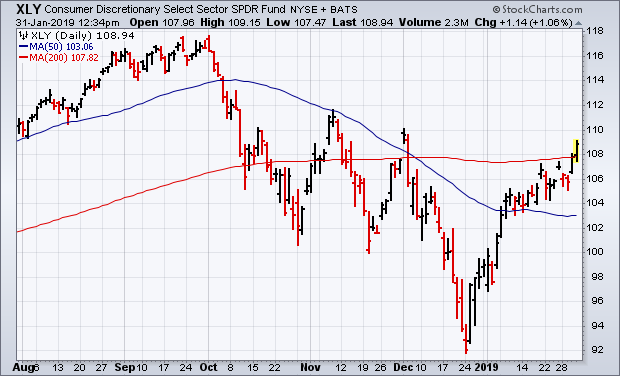
Editor's Note: This article was originally published in John Murphy's Market Message on Thursday, January 31st at 12:34pm ET. Chart 4 shows the Consumer Discretionary SPDR (XLY) trading above its 200-day line in today's trading... Read More
ChartWatchers February 01, 2019 at 03:46 PM
We're now deep into earnings season, with hundreds of companies reporting last week alone. The reaction to earnings so far has been mostly positive - witness the nice move higher in the market. But we've also seen some earnings misses, with those companies taking it on the chin... Read More
ChartWatchers February 01, 2019 at 03:36 PM
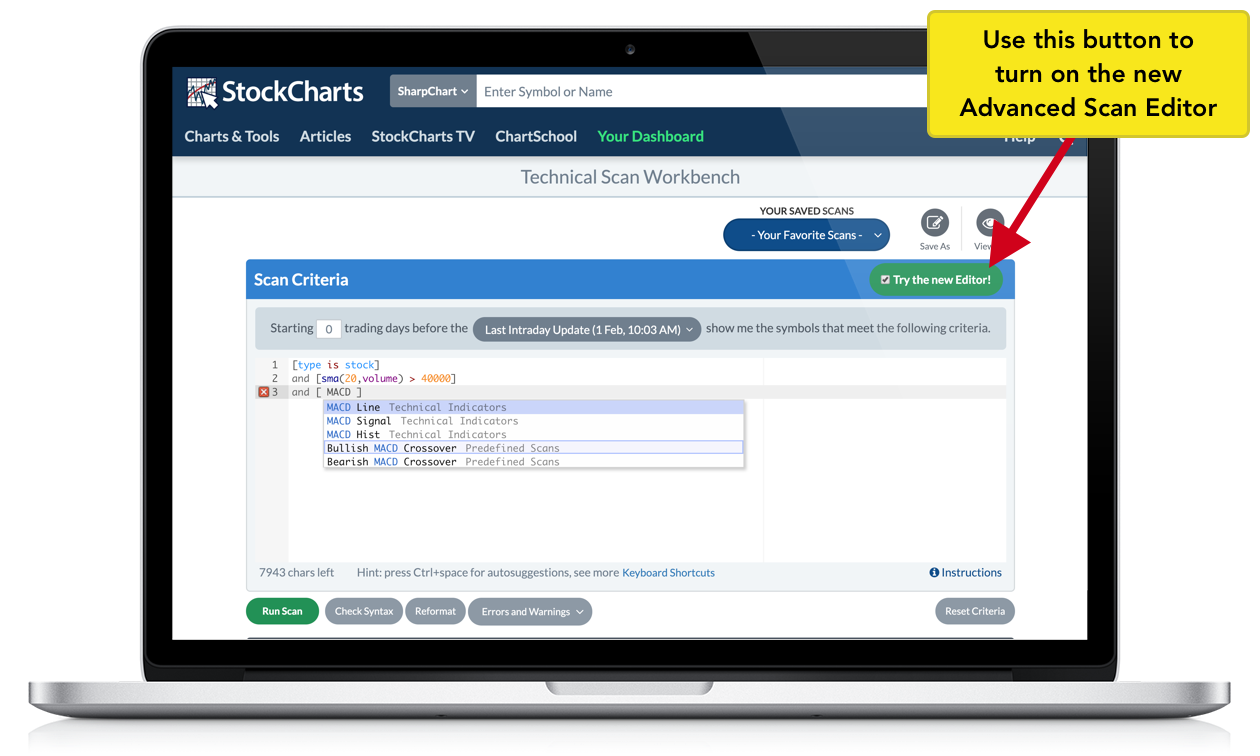
Calling all scanners! The biggest thing since sliced bread has just hit the Advanced Scan Workbench. Last week, we released a major upgrade to our premier scanning tool – the Advanced Scan Editor... Read More
ChartWatchers February 01, 2019 at 03:31 PM
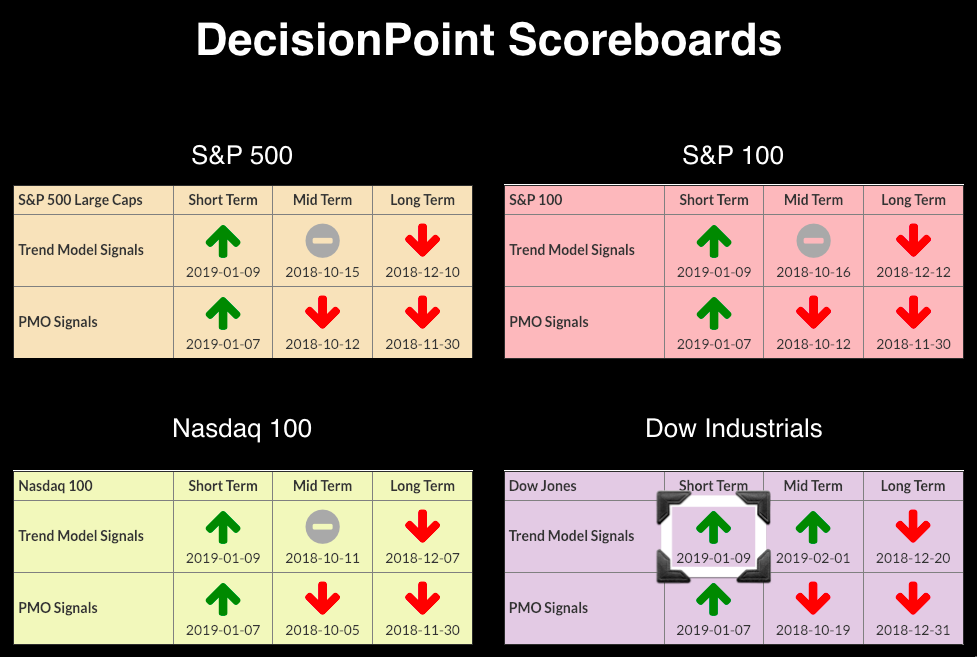
Today, we had a new Intermediate-Term Trend Model (ITTM) BUY signal trigger on the Dow Industrials ($INDU). Additionally, the SPY (which is not on the Scoreboards) triggered a new ITTM BUY signal as well... Read More
ChartWatchers February 01, 2019 at 11:56 AM
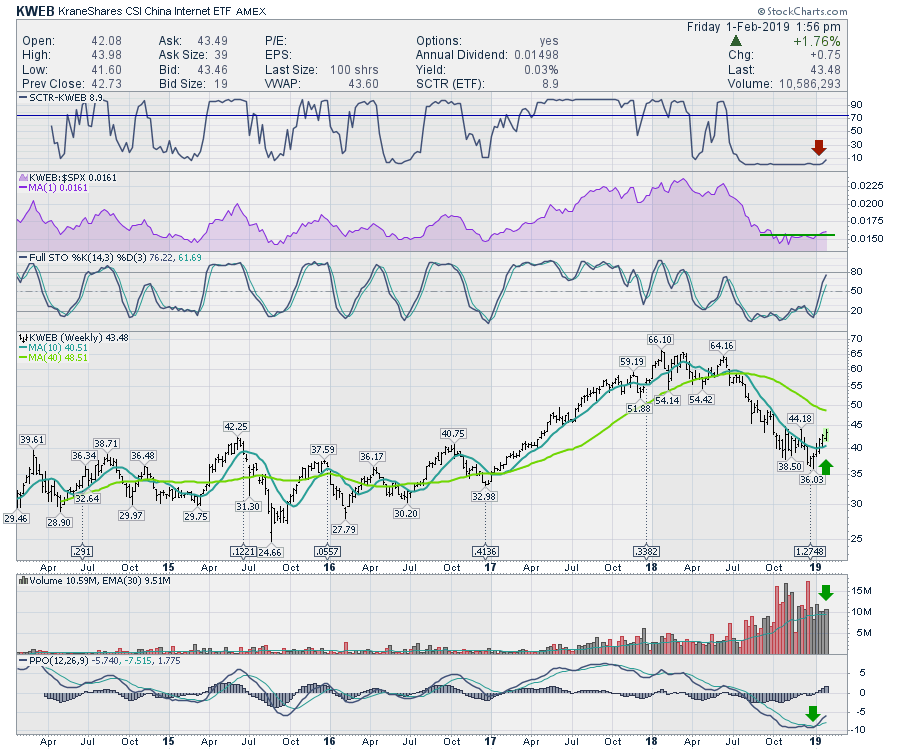
There are three areas of the market perking up nicely that you might not be hearing about much on the business news channels. These are Chinese stocks, Solar stocks and Industrial Metals... Read More