The Relative Strength Index (RSI) is a momentum indicator that chartists can use to measure the strength behind a price move. Moreover, chartists can also use RSI values to rank momentum and find the leaders.
As an indicator that measures the magnitude of gains relative to the magnitude of losses, RSI values above 50 indicate that the gains are outpacing the losses over the lookback period. The further above 50, the stronger the gains relative to the losses. Thus, RSI values above 70 indicate that the gains are seriously outpacing the losses. Put another way, RSI values above 70 reflect strong upside momentum.
The table below ranks 10 major index ETFs by 14-day RSI. RSI is above 70 for seven of the ten ETFs and these ten show strong upside momentum. The S&P MidCap SPDR, Russell 2000 iShares and S&P SmallCap iShares are at the top of the list with the highest RSI values. Even though they may seem "overbought" short-term, strong momentum moves are usually bullish longer term.
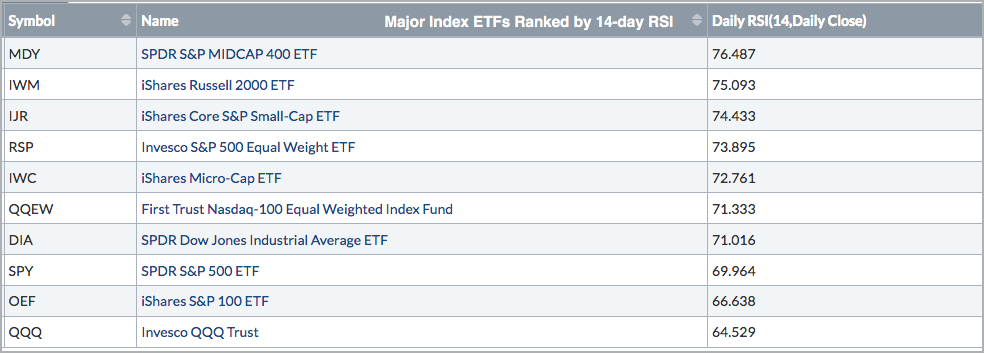
The large-cap ETFs are at the bottom of the list. The S&P 500 SPDR is just below 70, while the S&P 100 ETF and the Nasdaq 100 ETF are well below 70. This ranking shows that QQQ and OEF, which represent large-caps, are lagging when it comes to momentum.
Chartists can also compare the RSI values of complementary pairs. In particular, note that the Russell 2000 iShares is outperforming the S&P 100 ETF, the Equal-weight S&P 500 ETF is outperforming the S&P 500 SPDR, and the Equal-weight Nasdaq 100 ETF is outperforming the Nasdaq 100 ETF.
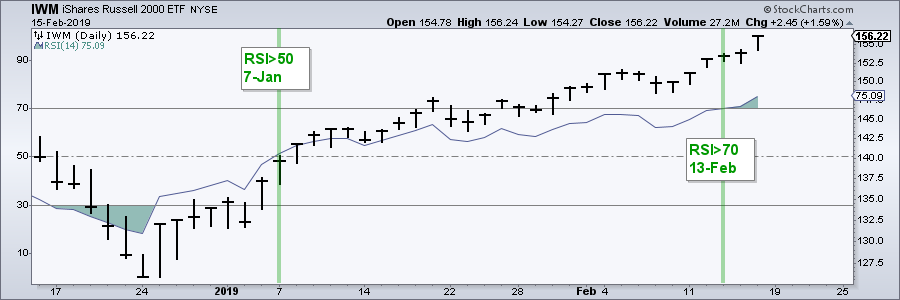
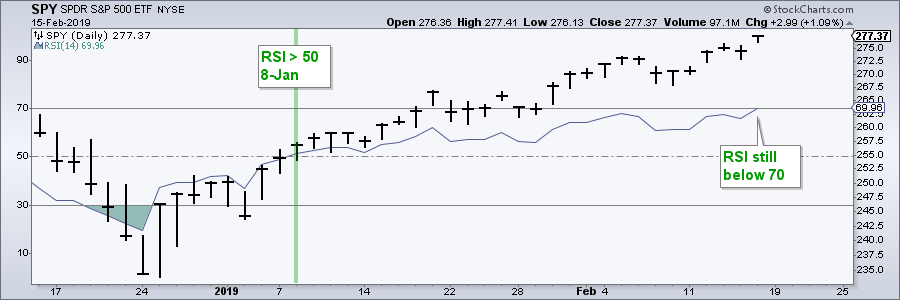
We can also find signs of relative strength by comparing the crossing points for two key RSI levels: 50 and 70. The charts below show SPY and IWM with 14-day RSI as an overlay (behind the price plot). Comparing RSI levels, we can see that 14-day RSI moved above 50 on January 7th for IWM and on January 8th for SPY. Thus, RSI crossed its centerline a day earlier for IWM and this showed relative strength. Furthermore, 14-day RSI crossed above 70 on February 13 (Wednesday) for IWM and has yet to cross 70 for SPY.
On Trend on YouTube
China Goes for a Breakout
- Keys to the Short-term Uptrends
- Ranking Sector Breadth Indicators
- Double Bottoms in China (plus YUM)
- Autos are a Sickly Group (plus TSLA)
- Only 1 FAANG Above 200-day
- Stock Setups: CAT, GLW, ROST, TJX
- Click here to Watch
Stocks Refuse to Back Down
- QQQ and SPY Hold as IWM Outperforms
- XBI Outperforms IBB (plus ITB, XRT, KRE)
- Focus on Payments Industry (SQ, V, MA...)
- Weakness in Media Land (CBS, NWSA, DIS...)
- Combining Daily and Weekly Analysis (FFIV)
- Stock Setups: ISRG, FORM, FNSR, IONS, VCEL
- Click here to Watch
- Arthur Hill, CMT
Senior Technical Analyst, StockCharts.com
Book: Define the Trend and Trade the Trend
Twitter: Follow @ArthurHill
