There are three areas of the market perking up nicely that you might not be hearing about much on the business news channels. These are Chinese stocks, Solar stocks and Industrial Metals.
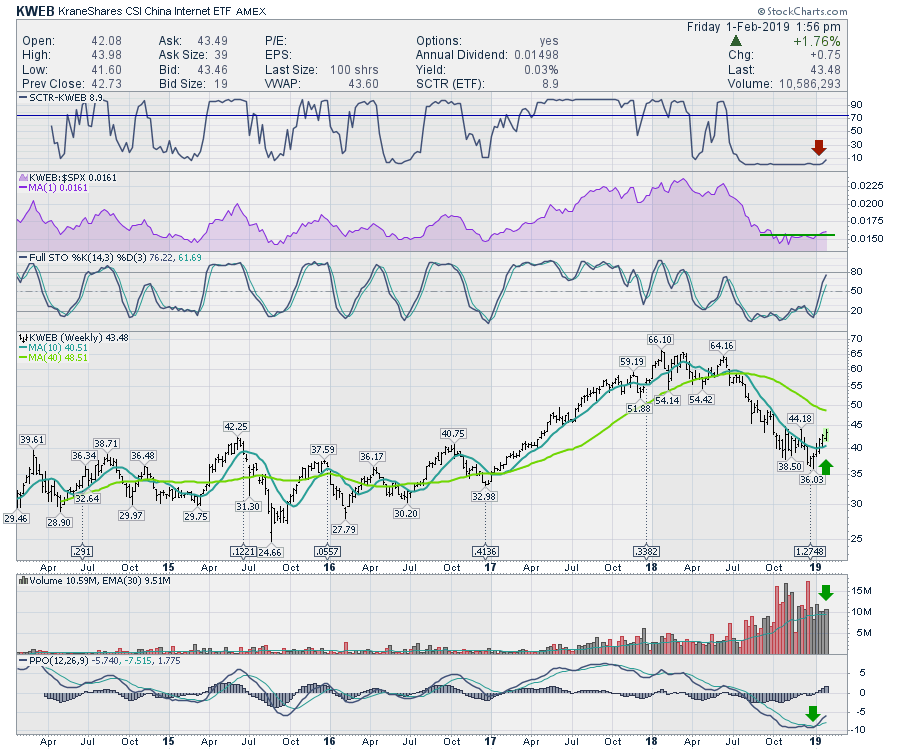
For the Chinese stocks, I will use the KWEB ETF to represent a broad group of Chinese technology companies. The Chinese Technology ETF is turning up nicely. The SCTR is still very low, but some individual stocks in the ETF and the broader Chinese technology group look pretty strong. I talked more about these stocks on the January 23rd episode of Market Buzz.
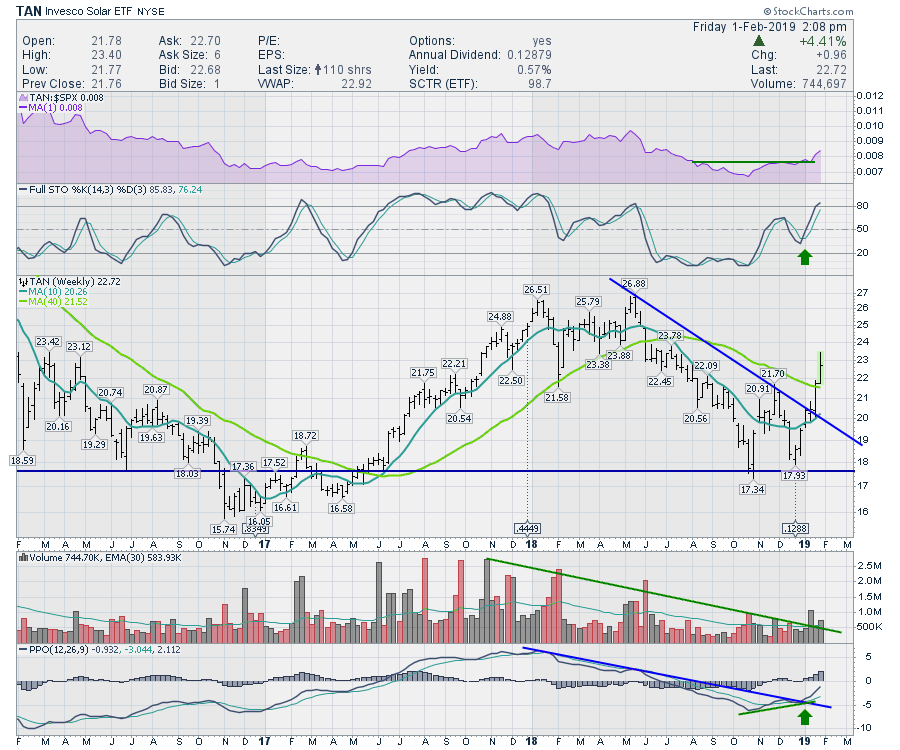
 Secondly, the Solar area of the Market is also perking up. I recently did a Don't Ignore This Chart article on JKS and also went through some other promising Solar stocks on Market Buzz February 1, 2019.
Here is the TAN ETF. Doesn't get much sunnier than this!
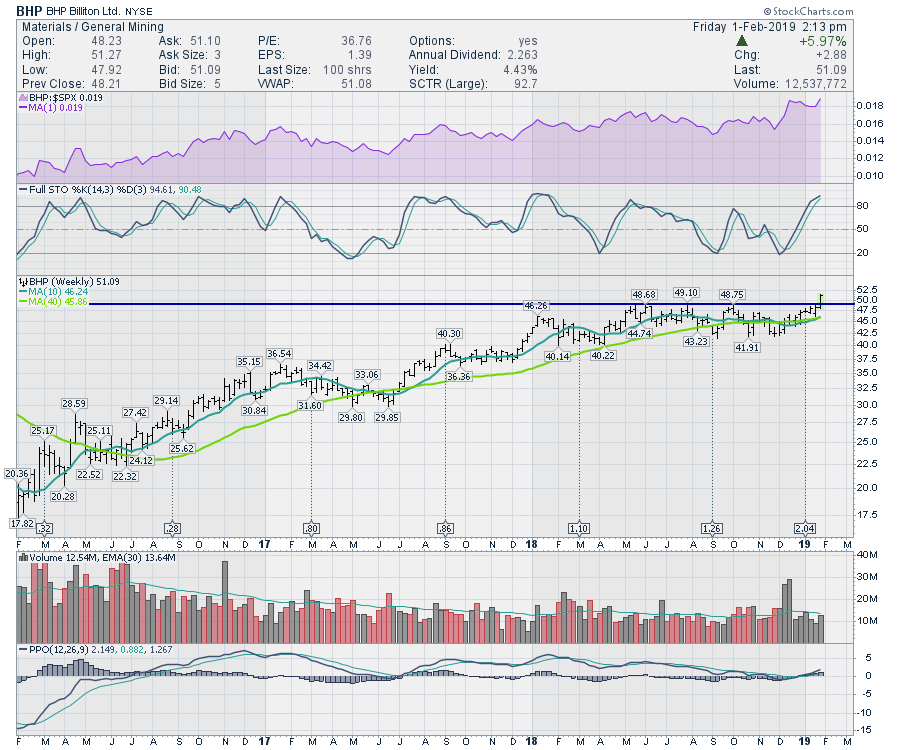
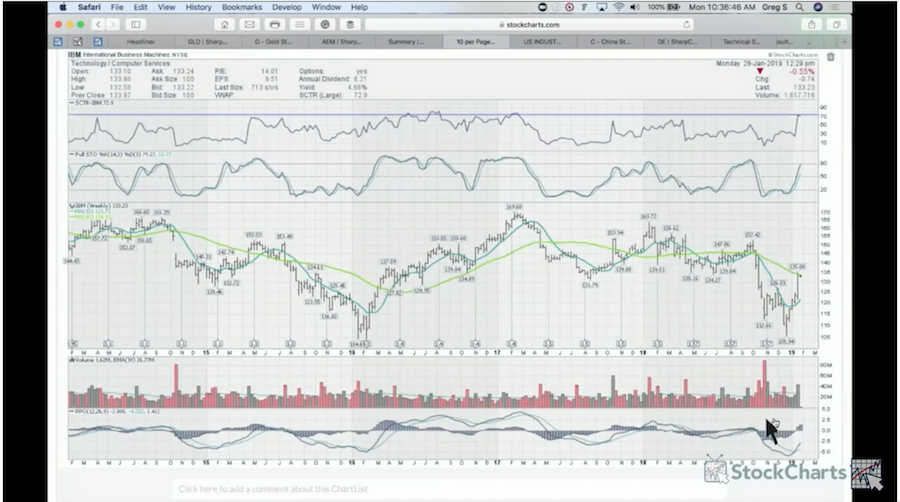
 Lastly, the industrial metals group is starting to run. One particular US-listed stock that made new 52 week highs this week is BHP Billiton. BHP is a world leader in mining. I will be working through this industry group on Market Buzz on Wednesday morning at 10:30 ET. Watch it on StockCharts TV!
 In general, the big commentary areas of the market continue to perform well, especially with some Fed comfort. Hopefully these other areas will give your portfolio a little bigger alpha to the market.
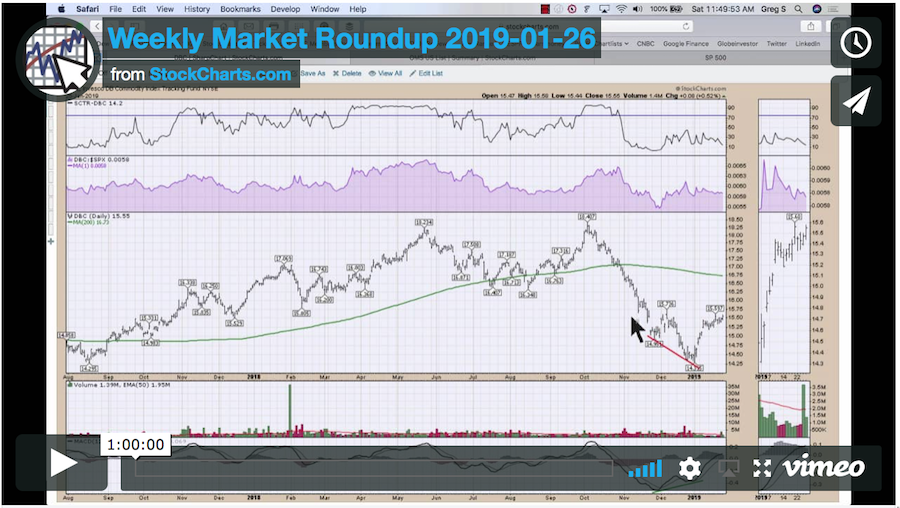
There are lots of my videos you can watch from over the past week. This is the latest Weekly Market Roundup.
 I will also have a February Market Roundup with Martin Pring. Look for that on the StockCharts YouTube page or on my Vimeo channel.
I was on the MarketWatchersLive show with Erin Swenlin, where I presented Gold stocks. Click on the image to enjoy the video.
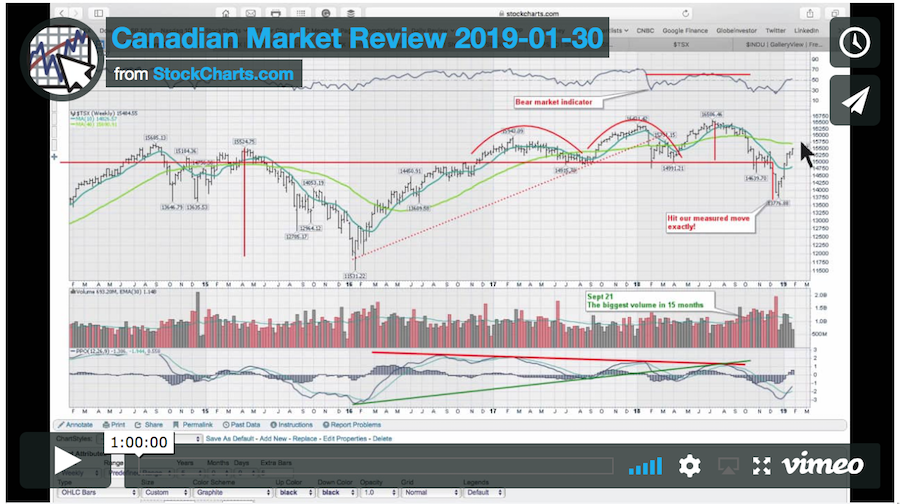
Here is this week's Canadian Technician Market Review.
If you would like to learn more about the basics of charting, check out Stock Charts for Dummies. The first section of the book walks through all the chart settings to get the charts you want, the second section explores why you might use charts for investing and the third section is about putting it all together.
Click here to buy your copy of Stock Charts For Dummies today!
If you are missing intermarket signals in the market, follow me on Twitter and check out my Vimeo Channel. Bookmark it for easy access!
Good trading,
Greg Schnell, CMT, MFTA
Senior Technical Analyst, StockCharts.com
Author, Stock Charts for Dummies
Hey, have you followed Greg on Twitter? Click the bird in the box below!
Want to read more from Greg? Be sure to follow his StockCharts blog:
The Canadian Technician
