Editor's Note: This article was originally published in John Murphy's Market Message on Friday, March 1st at 11:55am ET.
After having one of the strongest starts to a new year in history, major stock indexes find themselves testing yet another potential overhead resistance barrier. And they're doing so while in an over-extended technical condition. But they've been looking over-extended for most of the past month. Chart 1 shows the Dow Industrials testing their early November intra-day high at 26,300 (first red circle). A decisive close above that previous peak would clear the way for a retest of last October's record high. But it has to clear its November high first. The Dow remains above its 200-day moving average (red arrow). Its blue 50-day average, however, remains below its 200-day line. On a more positive note, its 20-day average (green arrow) remains above the other two longer averages. If the Dow does pull back, that would the first moving average to be tested. Maybe even the 200-day. One cautionary note is fact that its daily MACD lines (lower box) have been converging over the last month and are close to turning negative. That would be their first time in negative territory since the end of December. That might be enough to signal some short-term profit-taking. Or possibly a period of consolidation to work off its overbought condition.
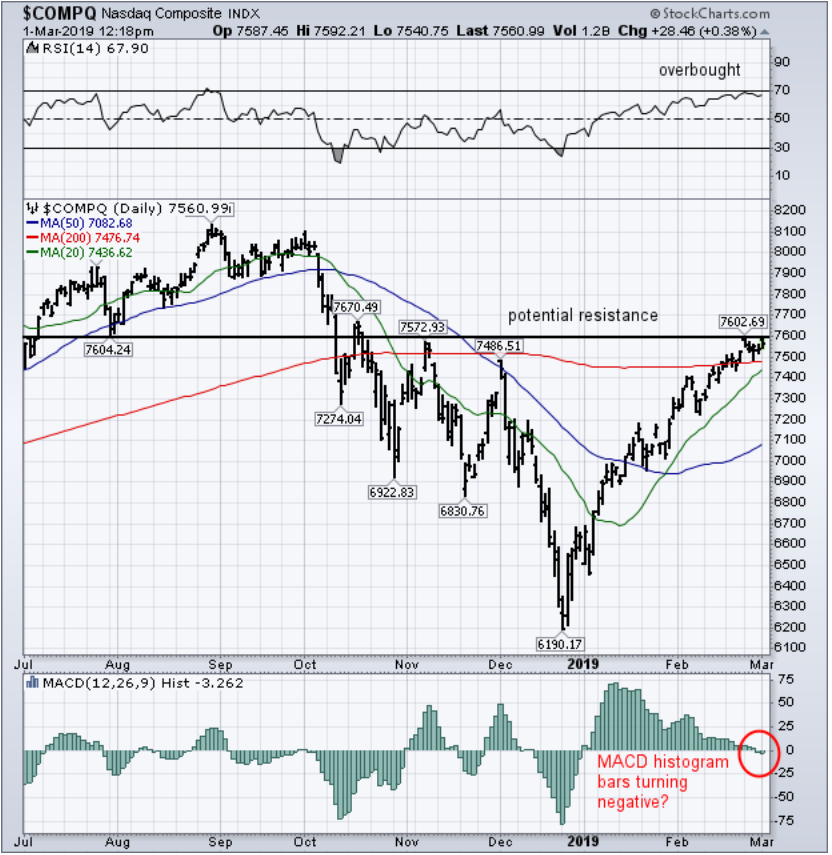
Chart 2 shows the S&P 500 in a similar technical condition. The SPX is testing its November intra-day high at 2815. If it does pull back, it could retest its 20 and 200-day averages (green and red lines). Chart 3 shows the Nasdaq Composite Index also testing its November intra-day high at 7572. The lower box in Chart 3 shows its MACD histogram bars in danger of falling below their zero line (red circle). That would signal that the MACD lines themselves are turning negative.
Chart 1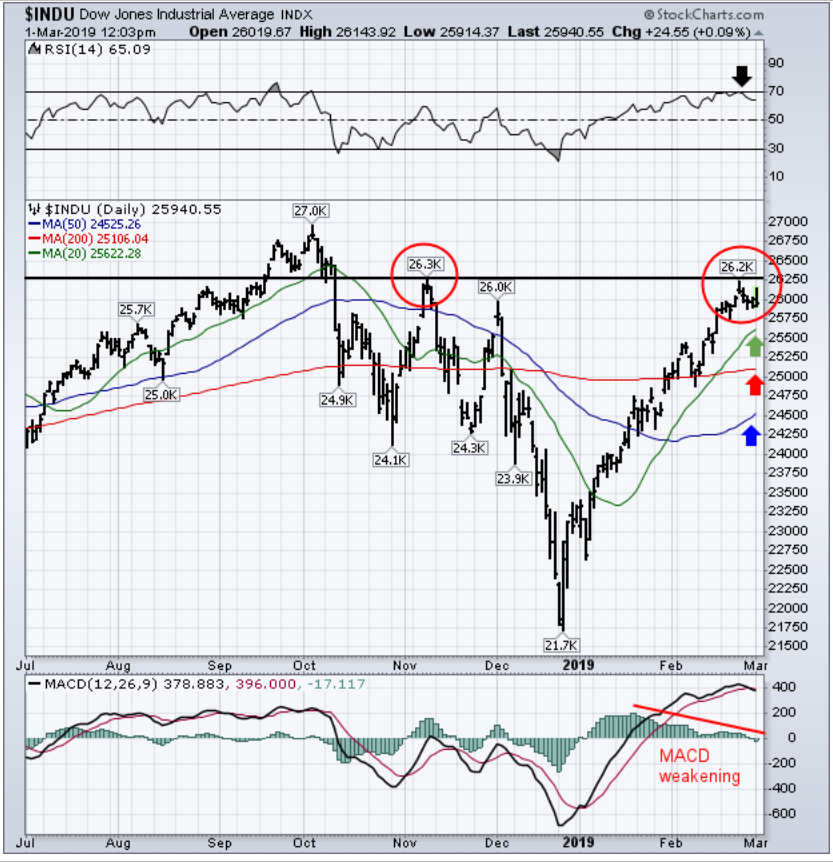
Chart 2
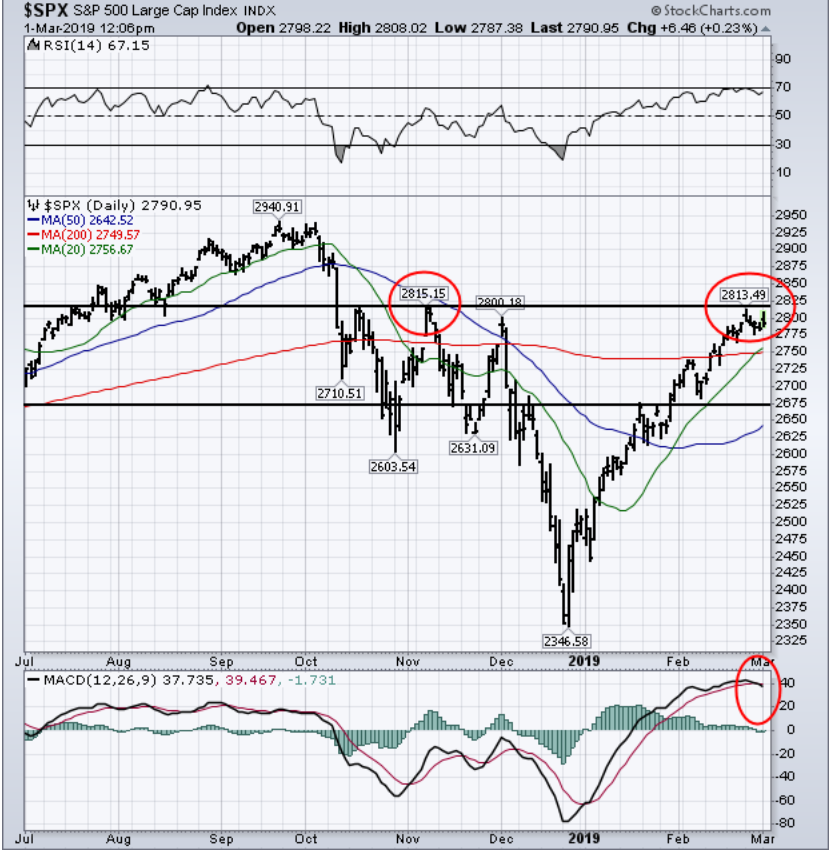
Chart 3