The auto charts are a mixed bag. For the last few years, they have had trouble outperforming; even Tesla (TSLA) has been dead money for buy-and-holders. However, it's starting to look like the broader group wants to start running; below are a few charts of interest.
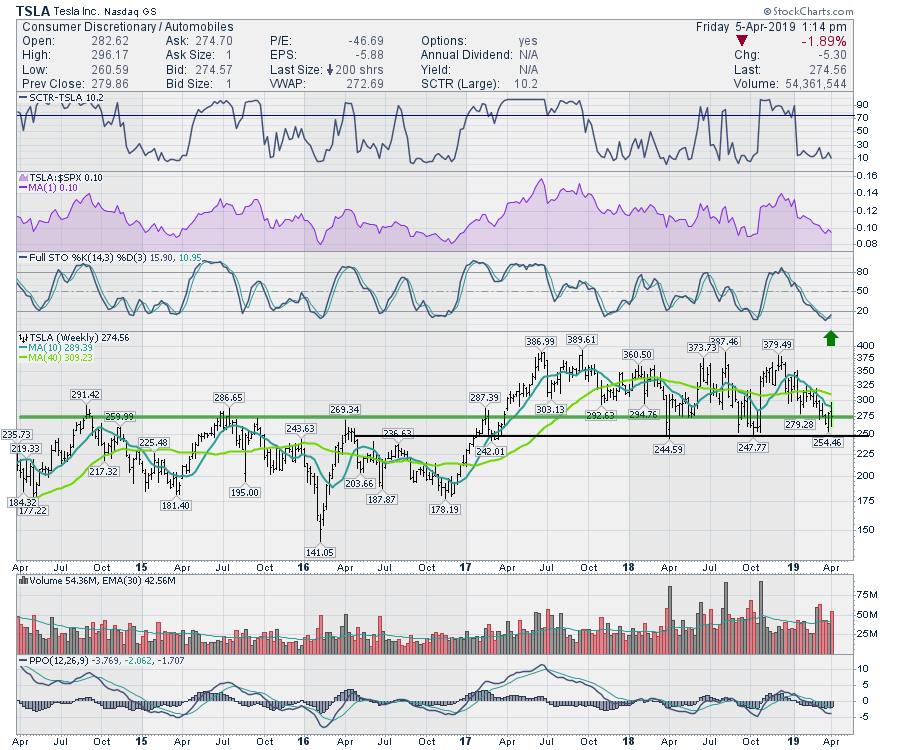
Tesla sits at the low end of the multi-year range. While the Tesla chart is definitely the most volatile automaker, it does not mean that the rest of the group can't go higher. If Tesla is going to keep bouncing off the lows, that is definitely bullish.
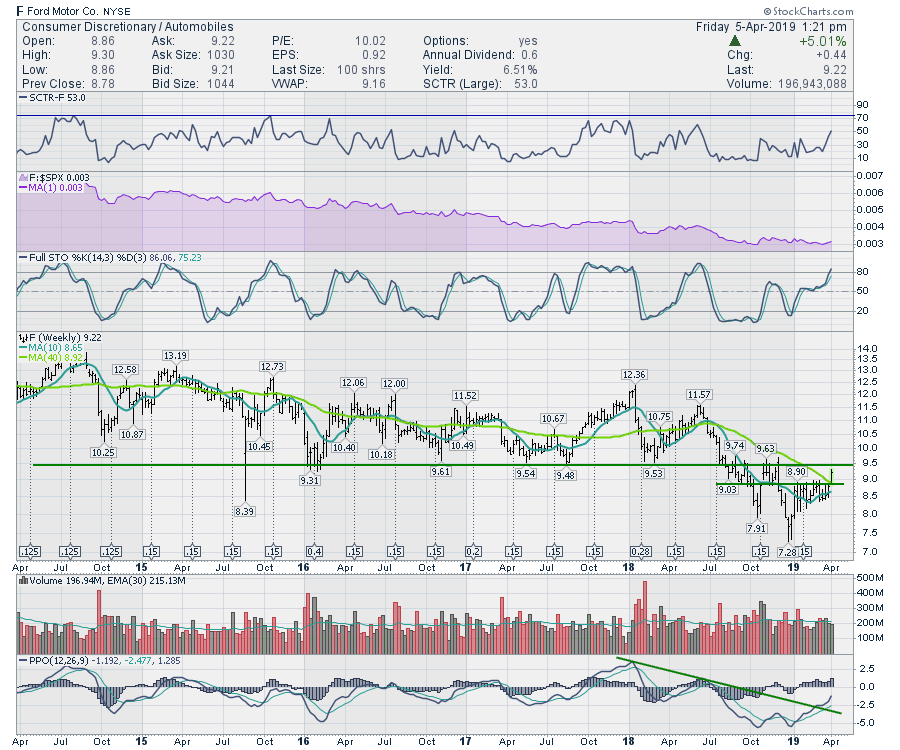
 We also had a nice 3-month high on Ford (F). Ford has a lot of resistance overhead at $9.50, which was a major level of support back in the 2014-2017 time period. "Support becomes resistance" once support is broken - that is one of the key premises of technical analysis. If Ford can move and stay above this long-term level, that will be quite an accomplishment.
The SCTR is a ranking method for stocks that compares the price action of a stock with the price action of other stocks within a group. In this case, the group is large-cap stocks. When a stock outperforms the rest of the market, that can be a good way to locate leadership; an indicator's up move demonstrates the stock's ability to perform as a leader. The SCTR ranking for Ford has never made it into the top 25% at any point in the last five years, which would be above the blue line on the indicator; thus, Ford has not been a leader for a long period of time.
If we look at the SCTR indicator on the Tesla chart above, you can see when the Tesla price action outperformed by looking at the SCTR. The bottom line is that it would be a remarkable achievement for Ford to start outperforming from this breakout.
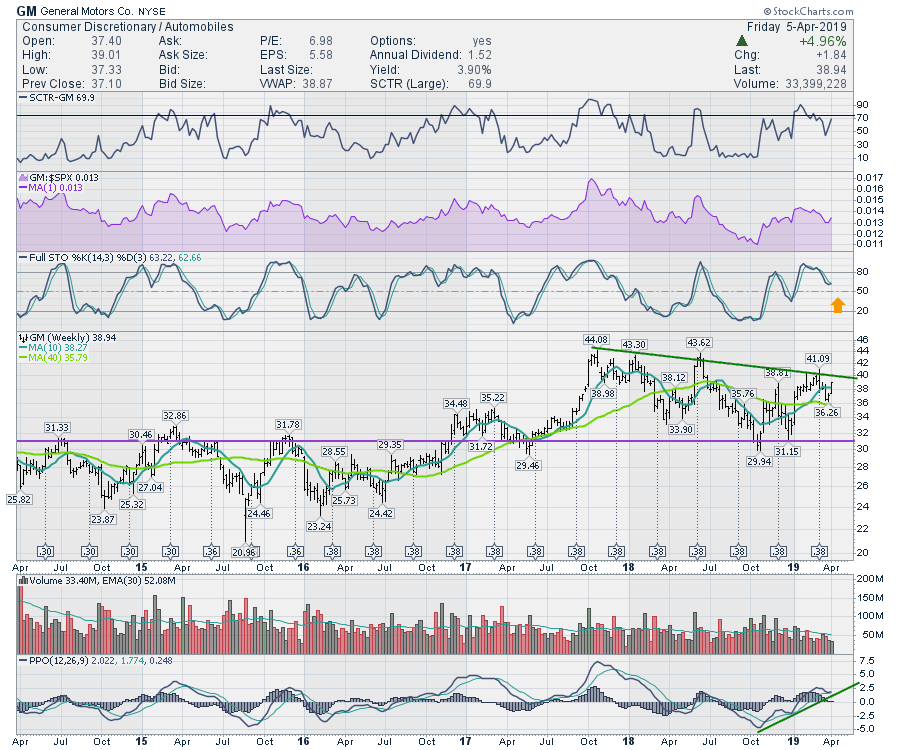
 While all the charts in the auto sector are trying to break through downtrends or sideways trading ranges, it would be a major move if they start to break out as an industry. GM has one of the stronger charts in the group, but it is still in a trading range. The PPO indicator looks like it is trying to turn up while above zero, marking this as a critical place on the chart. Usually, this is a very bullish place to jump on the trend with a close stop.
 There are other charts setting up nicely in the group. Toyota, Tata Motors and Honda all are trying to set up with the PPO momentum indicator turning higher. I am also starting to notice car part manufacturers turning up as well. If the Yen drops, that could help Toyota and Honda outperform as well.
The bottom line is that it looks like the car companies are getting ready to surge. In an environment where the whole industry is trying to push higher, that can be very supportive for higher prices.
Good trading,
Greg Schnell, CMT, MFTA
