 Relative Rotation Graphs can be a great asset in getting a high-level overview of what is going on in the markets and keeping an eye on the big picture. Beyond that, though, they can also help you to drill down to find new individual investment possibilities and trading ideas.
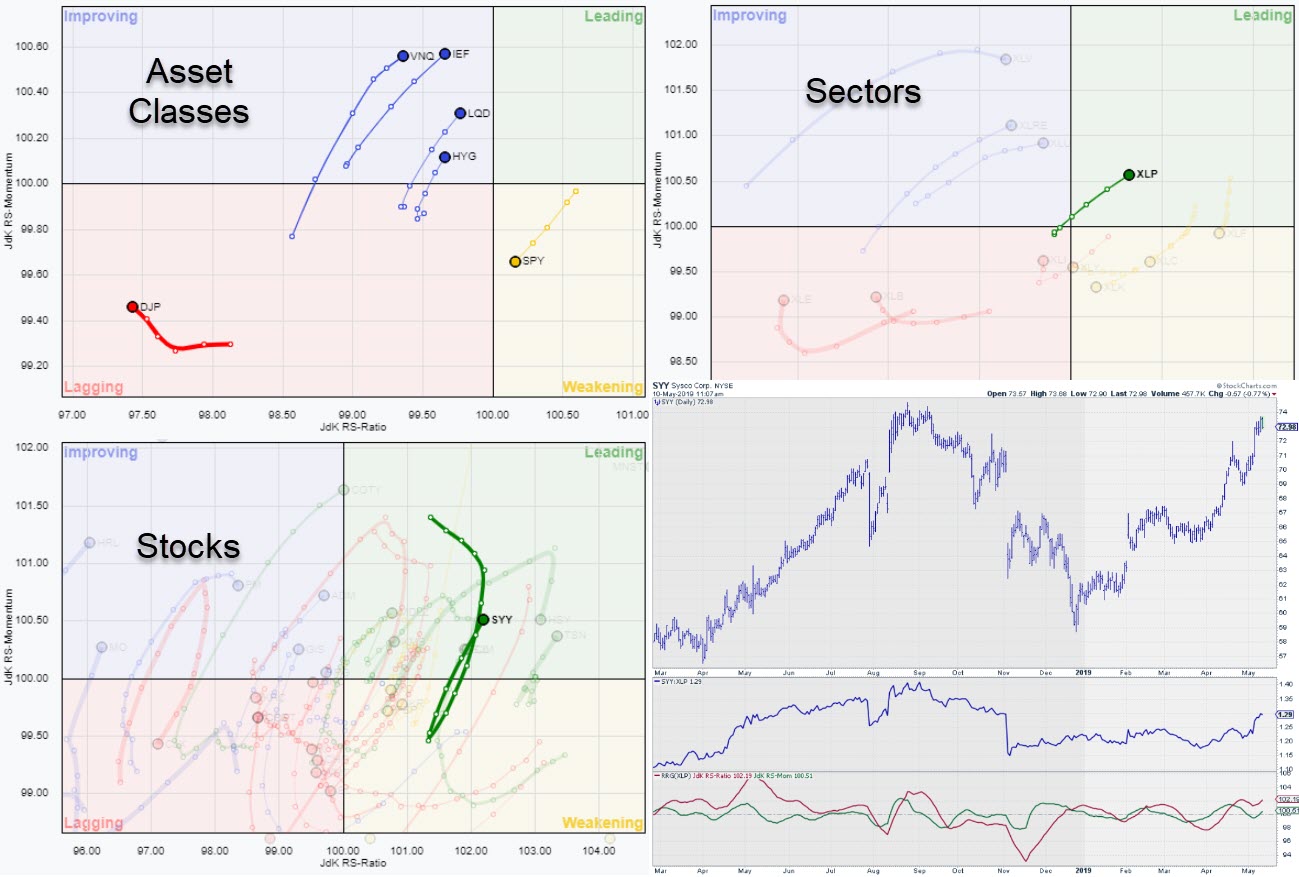
For this week's ChartWatchers newsletter, I will use three Relative Rotation Graphs to make a case for a single stock trade idea.
Starting At The Top
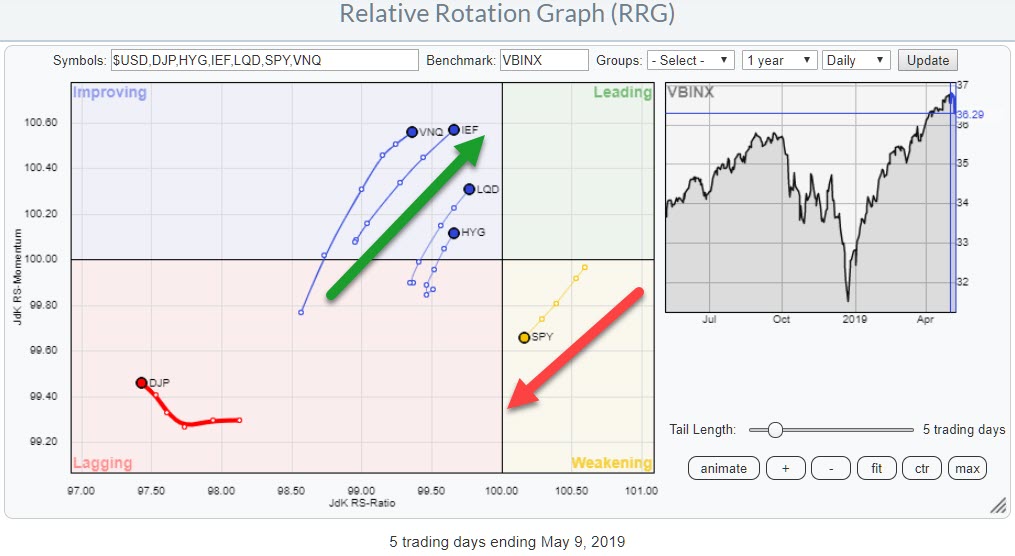 The daily RRG for Asset Classes above shows the rotation of various asset classes against the Vanguard Balanced Index, which replicates a balanced portfolio holding 60% in stocks and 40% in bonds. Over the past few weeks, the rotation has started to shift in favor of fixed income asset classes and real estate. Commodities is still very detached from the other components on the RRG, but Stocks (SPY) has started to move inside the weakening quadrant and is now headed for lagging. This indicates that a more risk-OFF-based approach by market participants is taking shape.
Then Sectors
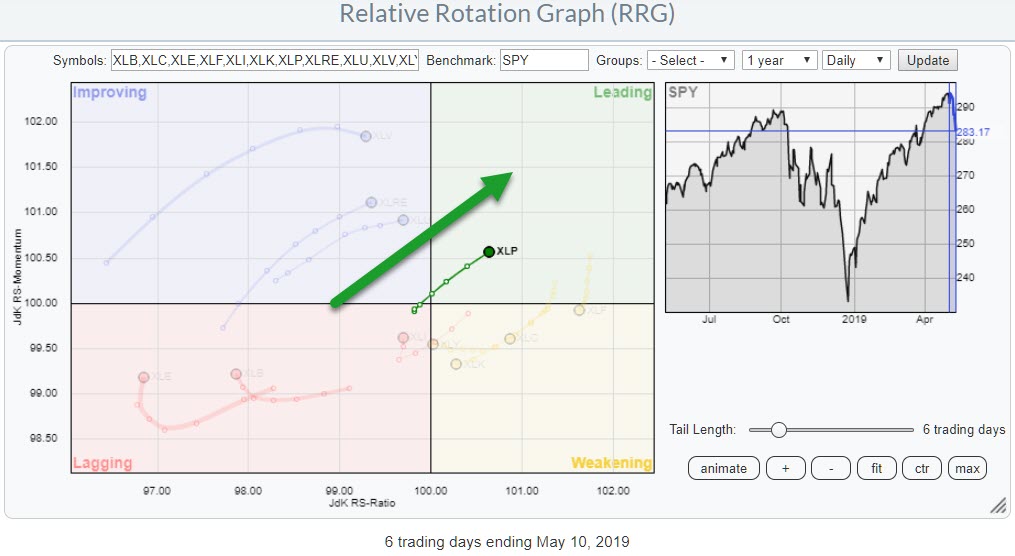 This risk-off mood is being translated into a sector rotation, which favors the more defensive parts of the market.
The daily RRG above shows the recent move of the Consumer Staples Sector into the leading quadrant. A salient detail is that XLP is now the only sector inside the leading quadrant.
Other defensive sectors like Health Care, Utilities, and Real-Estate are in the improving quadrant and moving towards leading. Utilities and Real-Estate are at a strong RRG-Heading, while Health Care has already started to roll over, making that move a bit questionable for now.
And Finally, Stocks
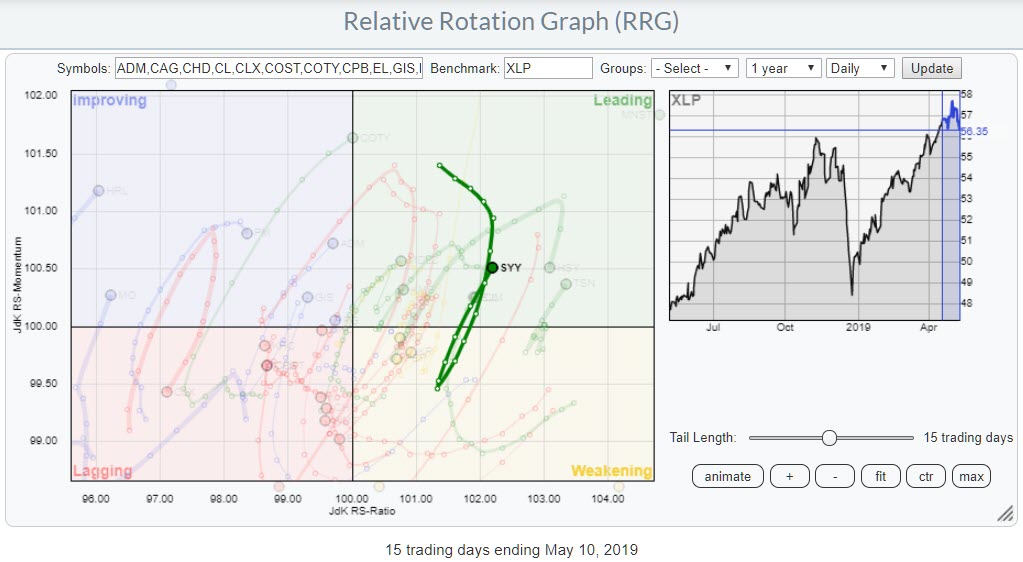 From the sector RRG, let's drill down into the individual stocks that make up the Consumer Staples (XLP) sector. The stock, or rather one of the stocks, that sparked my interest is SYY.
Sysco Corp. moved from lagging into improving at the beginning of April and pushed into leading halfway through the month. From late April into the first week of May, SYY rolled over and rotated through the weakening quadrant, but ultimately managed to rotate back into the leading quadrant this week and now seems set for another rotation through the leading quadrant. This makes it one of the leading stocks within the Staples sector.
Sysco Corp. - SYY
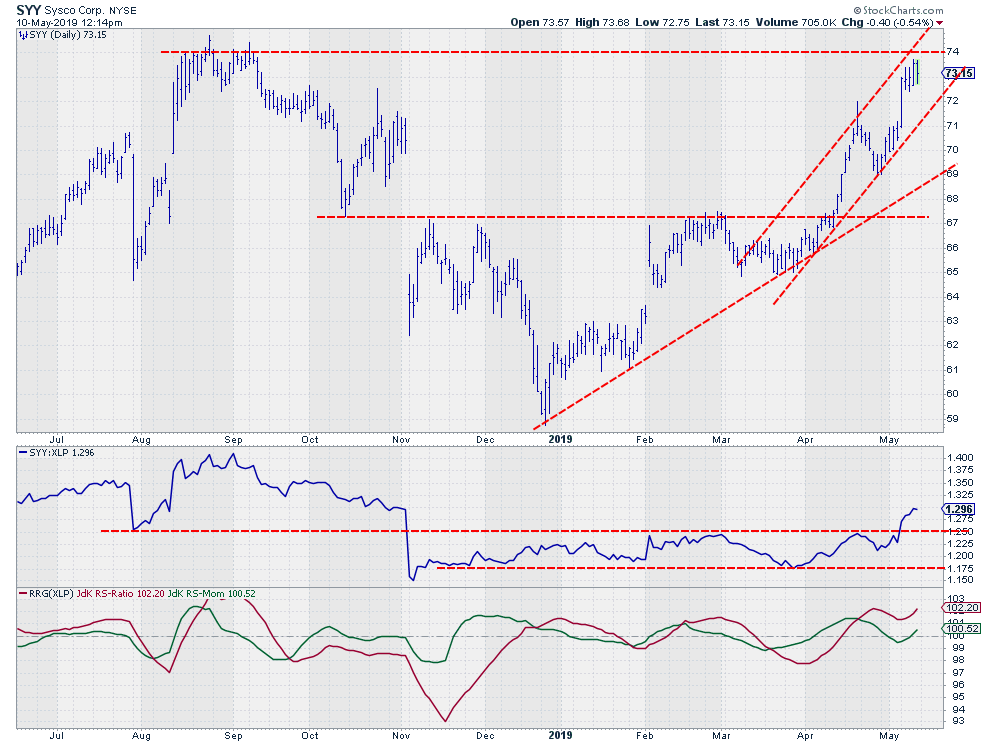 A study of the price chart in combination with relative strength shows that SYY broke beyond an important horizontal resistance level near $67 mid-April, which sparked an acceleration of the rally.
Following that break, a nice series of higher highs and higher lows has been established and the stock is still trading inside that channel. At the moment, overhead resistance is looming around $74. A break beyond that level will very likely ignite even more upside movement.
The good news is that there is enough room within the rising channel for SYY to take a break if that barrier cannot be taken out immediately.
Perhaps the strongest signs are coming from a relative strength perspective.
The raw RS-Line recently broke out of a long sideways range and started to rally. The RRG-Lines already pushed above 100 in the middle of April, putting SYY inside the leading quadrant on the RRG. The small dip of the JdK RS-Momentum line below 100 caused the rotation through weakening, but, with both lines now back above 100 and the tail on the RRG moving at a heading between 0-90 degrees, things currently look good for SYY.
Even if resistance near $74 cannot be taken out right away because of general market weakness, we are still looking at a risk-off market. SYY is expected to stay ahead of the XLP sector performance, while that sector is expected to stay ahead of the S&P 500 index for the time being.
My regular blog is the RRG Charts blog. If you would like to receive a notification when a new article is published, simply Subscribe using your email address.
Julius de Kempenaer
Senior Technical Analyst, StockCharts.com
Creator, Relative Rotation Graphs
Founder, RRG Research
Want to stay up to date with the latest market insights from Julius?
– Follow @RRGResearch on Twitter
– Like RRG Research on Facebook
– Follow RRG Research on LinkedIn
– Subscribe to the RRG Charts blog on StockCharts
Feedback, comments or questions are welcome at Juliusdk@stockcharts.com. I cannot promise to respond to each and every message, but I will certainly read them and, where reasonably possible, use the feedback and comments or answer questions.
To discuss RRG with me on S.C.A.N., tag me using the handle Julius_RRG.
RRG, Relative Rotation Graphs, JdK RS-Ratio, and JdK RS-Momentum are registered trademarks of RRG Research.
