 Relative Rotation Graphs can help to identify threats and opportunities within groups of securities. In this article, I will be looking at the position and rotation of the Communication Services Sector against the S&P 500 and other sectors, followed by a closer look at the rotation of various stocks inside that sector, especially Google.
From a Sector Perspective
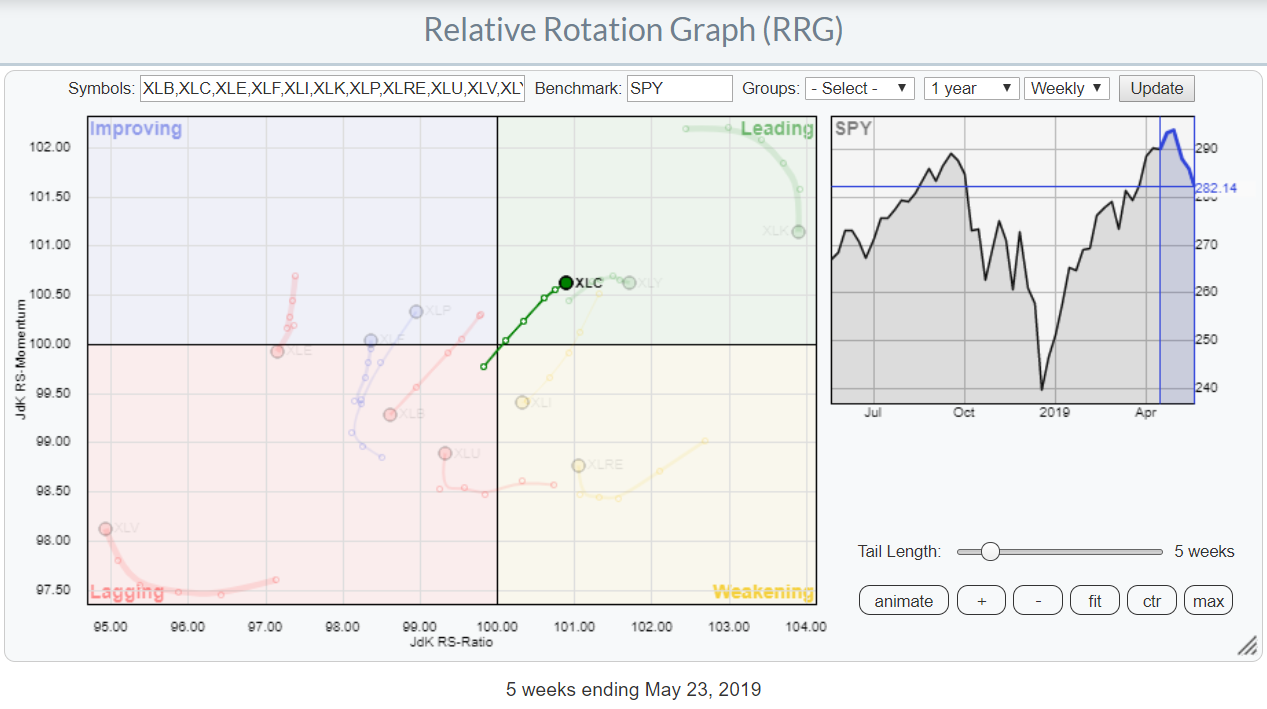 The RRG above shows the rotations for the 11 sectors in the S&P 500 index with Communication Services (XLC) highlighted.
The rotation into the leading quadrant at a strong RRG-Heading (0-90 degrees) indicates that this sector is in a relative uptrend against $SPX. Assuming a normal clockwise rotation, a continuation of that trend may be expected in the weeks to come.
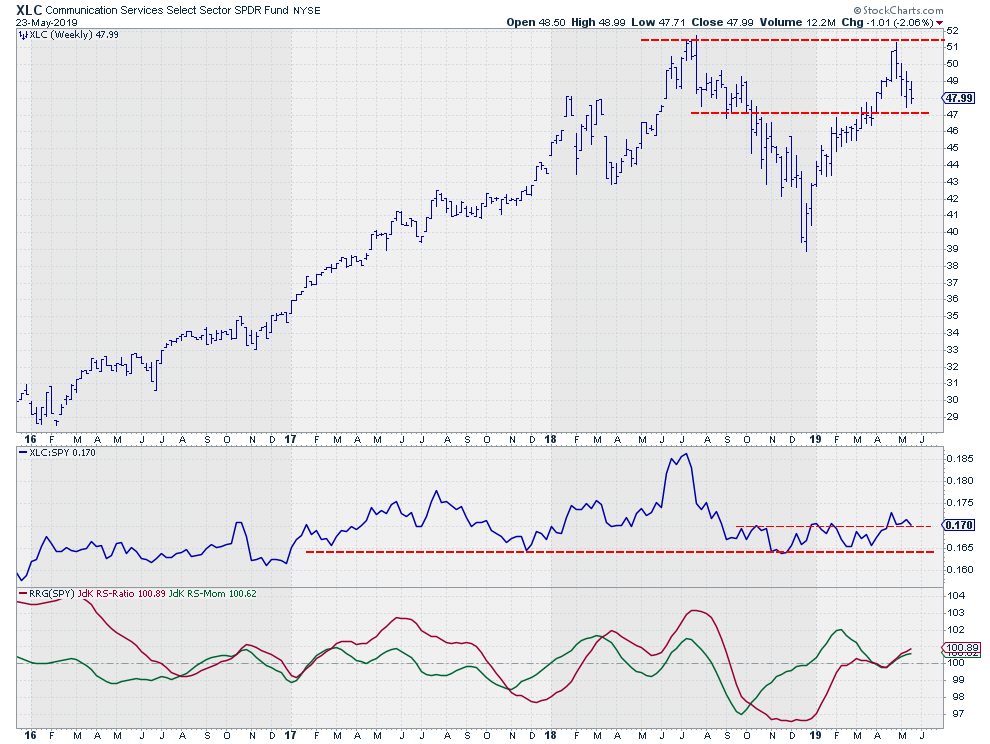 In line with the market, the Communication Services Sector failed to break above its prior high, which was set almost a year ago near $51. From a price perspective, that means that upside potential is capped around $51 for the time being.
On the downside, I am watching support in the area around $47, as supply and demand shifted around this level a few times in the last 12 months. With the sector ETF (XLC) trading around $48, that is a very limited downside risk for the time being.
A more positive message is coming from the relative strength line and the RRG-Lines comparing XLC with SPY.
After a strong decline in relative strength from July 2018 into November of that year, the RS-Line started to move in a range. The resulting RRG lines, especially the Jdk RS-Ratio, landed near the 100-level and remained close to these levels for a few months, meaning that this sector was moving in line with the S&P 500.
That situation recently came to an end when the RS-Line broke above its previous highs. It currently seems to be completing a bottoming process. The RRG-Lines picked up the improvement in April when they both bounced off the 100-level and started to rise together. This move is positioning the Communication Services sector well inside the leading quadrant, while still traveling at an RRG-Heading between 0-90 degrees.
A Look Inside
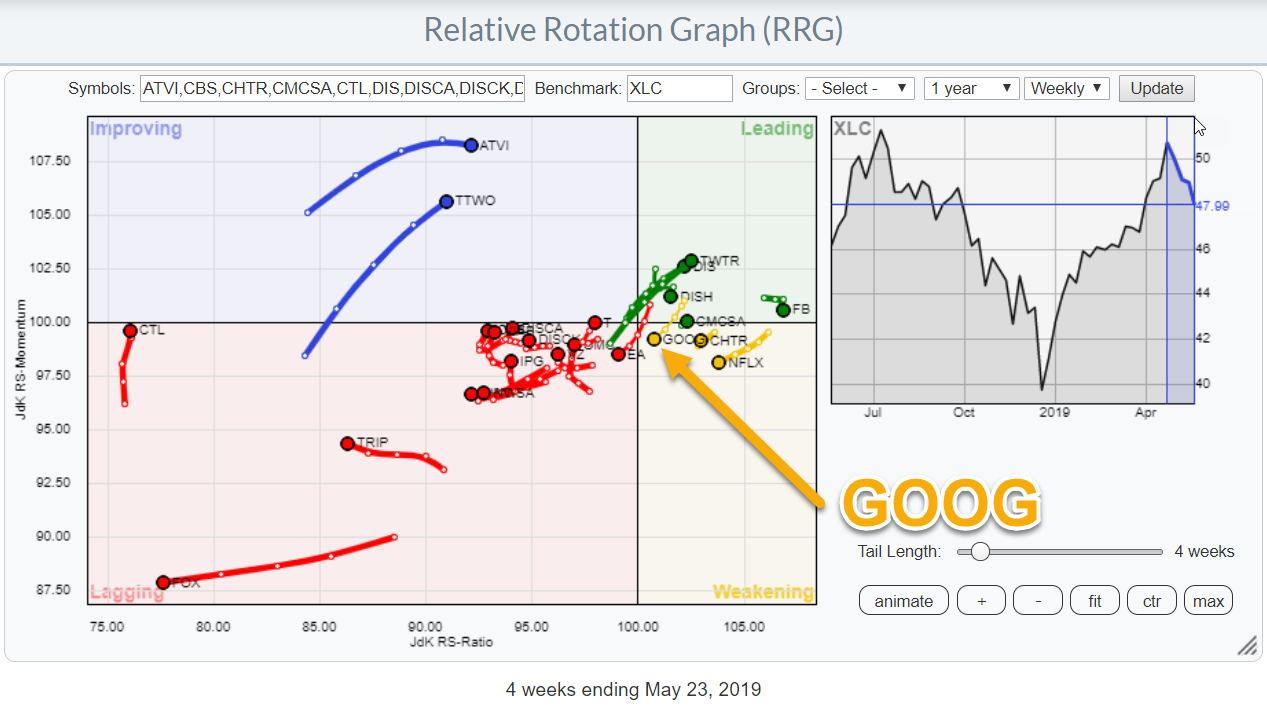
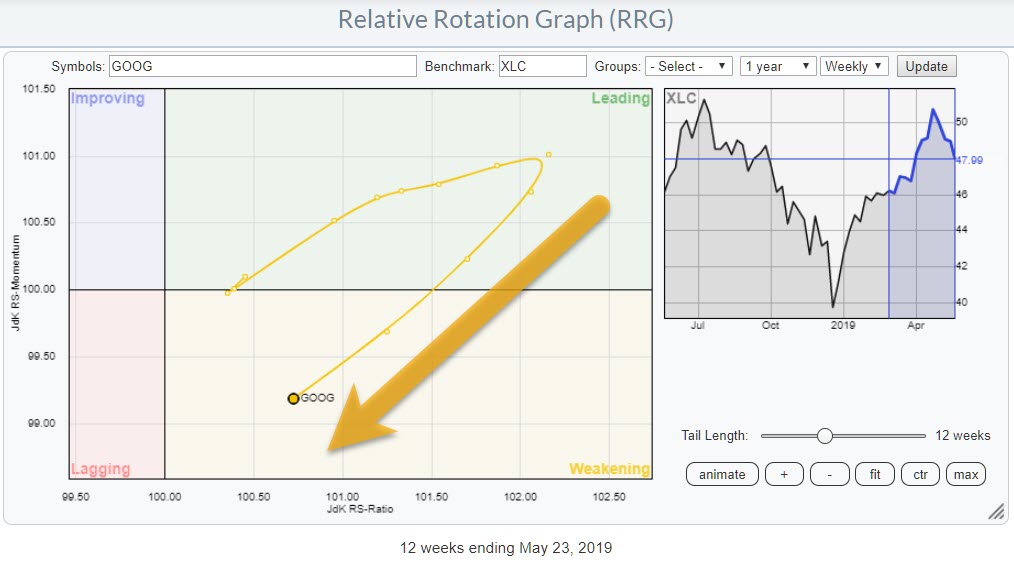 The RRG at the top of this article shows the complete population of the Communication Services sector against XLC (the benchmark). On that graph, GOOG is somewhat buried between other stocks and is not very visible. In order to zoom in on this particular stock and better see the recent rotation, I have printed the same RRG, but now only showing GOOG vs XLC.
The recent rotation clearly shows the weakness that Google is going through versus XLC. With a little over 11% weight for GOOG and GOOGL each, this totals around 22% total weight for Google within the sector. The good news is that this weakness is largely offset by Facebook. FB also accounts for 20% of the sector and is much further to the right in the RRG, at a high reading on the JdK RS-Ratio scale. That said, Disney, which is the fourth largest stock, is worth approaching from the long side.
Alphabet Inc - GOOG
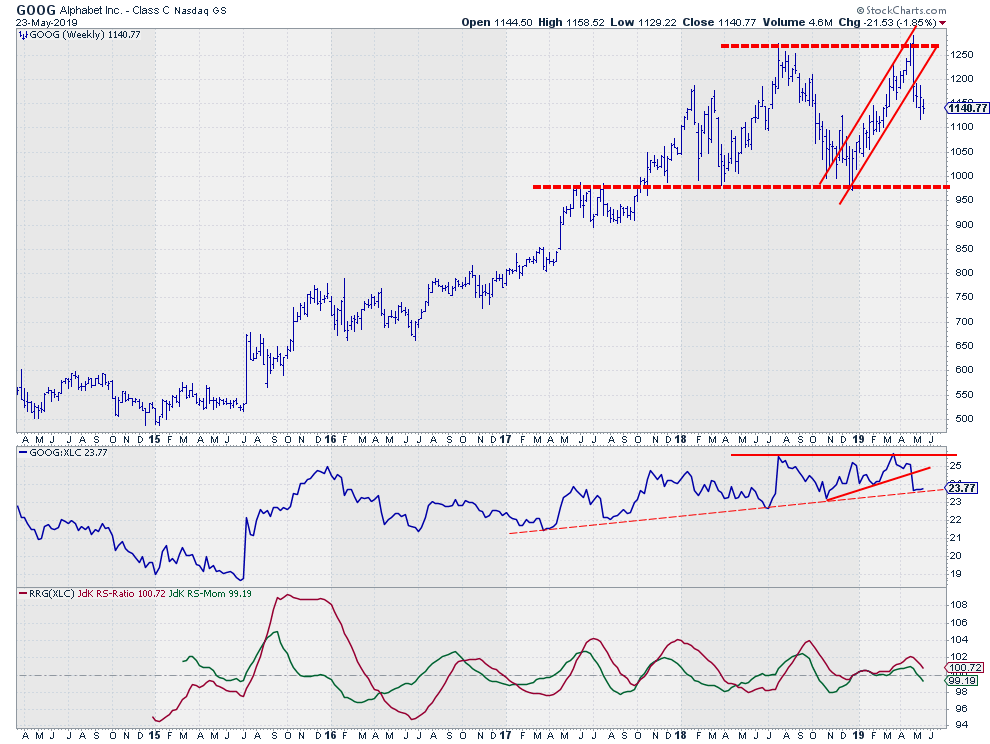 On the price chart, GOOG bounced off its former highs and left the rising channel that came into play at the end of 2018. The lower boundary of this range lies around $975, which is roughly 15% below current levels.
The RS-Line recently broke a short-term support line (solid) and is now resting at a longer version (dashed), while the RS-Momentum line has crossed below 100 and RS-Ratio is heading towards that level as well. A rotation into lagging seems to be around the corner.
All in all, the Communications Services sector is doing well compared to the S&P 500. Within the sector, however, it seems better to avoid Google for now.
My regular blog is the RRG Charts blog. If you would like to receive a notification when a new article is published, simply Subscribe using your email address.
Julius de Kempenaer
Senior Technical Analyst, StockCharts.com
Creator, Relative Rotation Graphs
Founder, RRG Research
Want to stay up to date with the latest market insights from Julius?
– Follow @RRGResearch on Twitter
– Like RRG Research on Facebook
– Follow RRG Research on LinkedIn
– Subscribe to the RRG Charts blog on StockCharts
Feedback, comments or questions are welcome at Juliusdk@stockcharts.com. I cannot promise to respond to each and every message, but I will certainly read them and, where reasonably possible, use the feedback and comments or answer questions.
To discuss RRG with me on S.C.A.N., tag me using the handle Julius_RRG.
RRG, Relative Rotation Graphs, JdK RS-Ratio, and JdK RS-Momentum are registered trademarks of RRG Research.
