 The "Best Six Months" strategy suggests that the best time to own stocks is from November to April, and the worst time is from May to October. Testing over the last 25 years confirms the performance differences between these two periods, but this strategy still leaves money on the table. This article will show that a "Best Eight Months" strategy outperforms the Best Six Months strategy. Furthermore, this strategy can be improved with market timing and switching to the 20+ YR T-Bond ETF (TLT) during the worst four months.
Yale Hirsch developed the Best Six Months strategy in the 1950s and this is one of many strategies covered by the Stock Trader's Almanac, which is a great resource. Jeffrey Hirsch currently runs the almanac and regularly updates the Best Six Months strategy using the Dow Industrials and MACD for market timing.
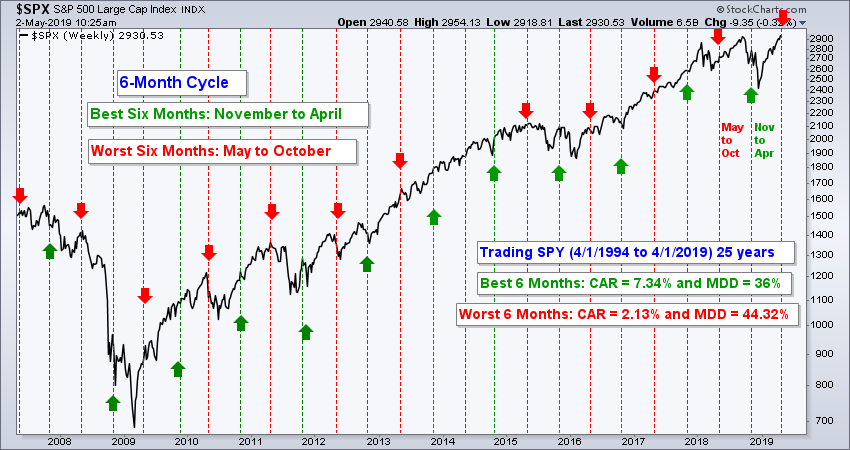 The chart above shows these periods with the green lines marking the start of the best six months and the red lines marking the start of the worst six months. Putting these periods to the test, the best six months has a clear advantage. Using total return SPY for trading, the Compound Annual Return was more than three times higher for the best six months (7.34% vs. 2.13%) and the Maximum Drawdown was lower (36% vs. 44%).
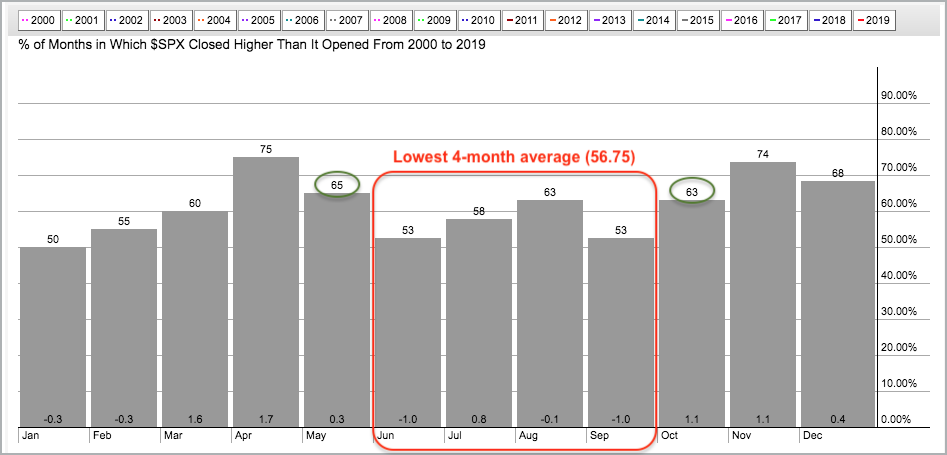
A look at the seasonality chart suggests that we can extend the best six months to the best eight months. Over the last 20 years, the S&P 500 closed higher 65% of the time in May and 63% of the time in October. In addition, the four month period from June to September was the worst four month stretch over the last 20 years. On average, the S&P 500 was higher just 56.75% of the time during these months. Furthermore, the sum total of the average gain/loss was a loss (-1.3%). The numbers at the bottom of each histogram bar show the average gain/loss for the month (-1.0, + 0.8, -0.1, -1.0).
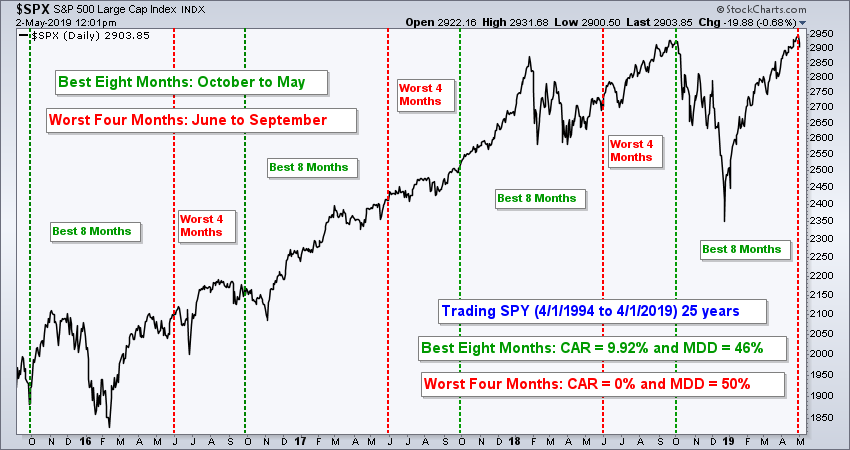
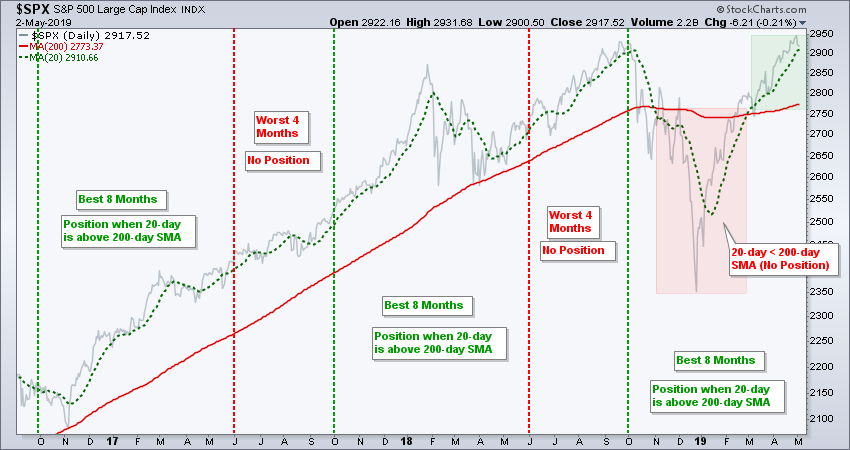
The chart below shows an example of the best eight months as well as some backtest results. Trading SPY over a 25-year period from April 1994 to April 2019, the best eight months outperformed the worst four months with a much higher Compound Annual Return (9.92% vs. 0%). The Maximum Drawdowns were both high though.
 The best eight months strategy clearly outperforms the best six months and adds value, but the Maximum Drawdown needs improvement. Some simple market timing may do the trick. The strategy is to buy SPY when the best eight months period is active and the 20-day SMA for the S&P 500 is above the 200-day SMA. The position is sold when the worst four months period begins OR when the 20-day SMA for the S&P 500 moves below the 200-day SMA. Note that the 20-day SMA for the S&P 500 could be above the 200-day SMA on June 1st, but the position would still be closed because the worst four month period began.
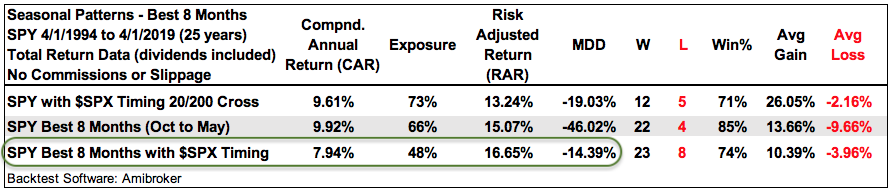
Now let's compare three different strategies over a 25 year period. The first is a simple strategy that buys and sells SPY based on the 20/200-day cross for the S&P 500. The second goes long during the best eight months and goes to cash during the worst four months. The third strategy combines the best eight months with the moving average signals for the S&P 500. Note that the S&P 500 is used for signals to prevent dividend drift and SPY is the trading vehicle so we can calculate the total return (dividends included). This is explained in the video (see below).
The system on the last line of the table below buys SPY when the best eight months period is active and the 20-day SMA for the S&P 500 is above the 200-day SMA. The system sells when the worst four month period is active OR the 20-day SMA for the S&P 500 is below the 200-day SMA. Using a trend filter reduced the Compound Annual Return to 8%, but the Risk-adjusted Return (16.65%) was the highest because the system was invested just 48% of the time. In addition, the market timing filter greatly reduced the Maximum Drawdown and it was the lowest of the three.
 When using the best eight months strategy with $SPX timing, chartists can consider an alternative to stocks when in cash (48% of the time). The 20+ YR T-Bond ETF (TLT) is a natural alternative during the worst four months and I also put this ETF to the test. You can learn more about the TLT addition in this week's On Trend video on Youtube. I also compare these systems to buy-and-hold as well as a basic moving average crossover system. Click here to watch.
Programming note: correction from Thursday's show and video. Some of the key metrics for the Best Eight Months with Market Timing and TLT were not correct on Thursday. I found a code error Friday morning, corrected the signals and revised the video. The key metrics are not as good, but still good enough to consider as a strategy, especially when considering the risk-adjusted returns.
Arthur Hill, CMT
Senior Technical Analyst, StockCharts.com
Author, Define the Trend and Trade the Trend
Want to stay up to date with the latest market insights from Arthur?
– Follow @ArthurHill on Twitter
– Subscribe to Art's Charts
– Watch On Trend on StockCharts TV (Tuesdays / Thursdays at 10:30am ET)
