 While browsing through the stocks in the DJ Industrials index, my attention was grabbed by the tails on KO and MCD, both in a positive way.
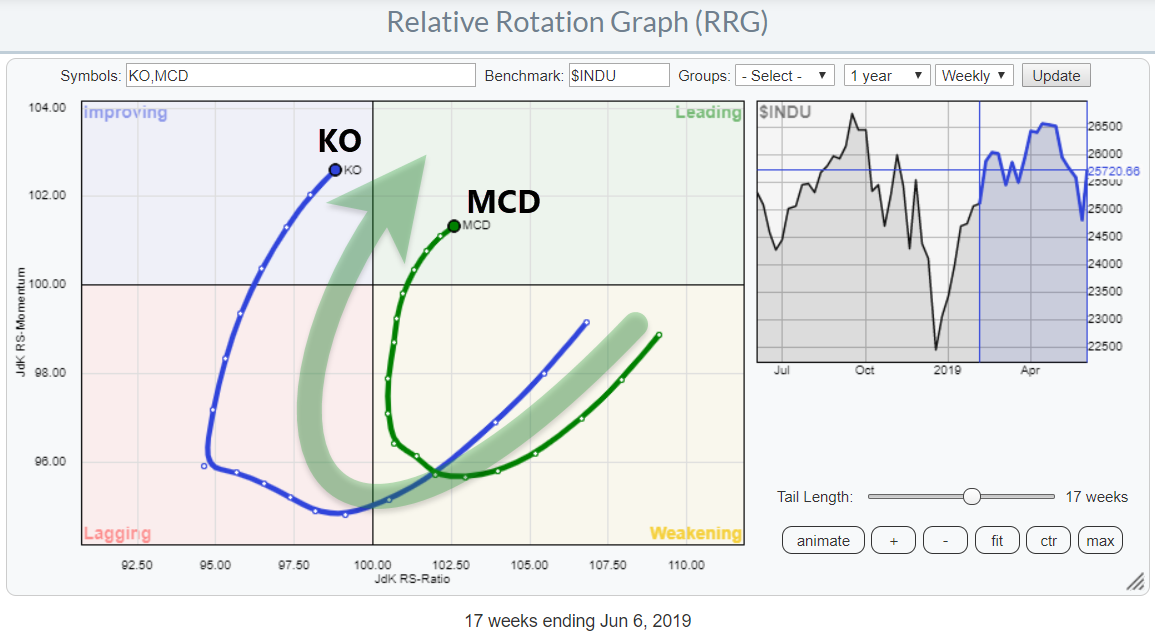
KO is making a wide rotation through lagging into improving and is now very close to crossing over into the leading quadrant. MCD, meanwhile, is already inside that leading quadrant, having completed a rotation through weakening without hitting the lagging quadrant.
When you toggle* through the tails on the RRG of the Dow 30 stocks against $INDU, you can easily notice these two tails as being of potential interest. They both have very regular rotations, they are of decent length and they are both moving at a strong RRG-Heading. These seem like reasons enough to put them on the SharpChart workbench for further inspection.
Coca Cola Co. - KO
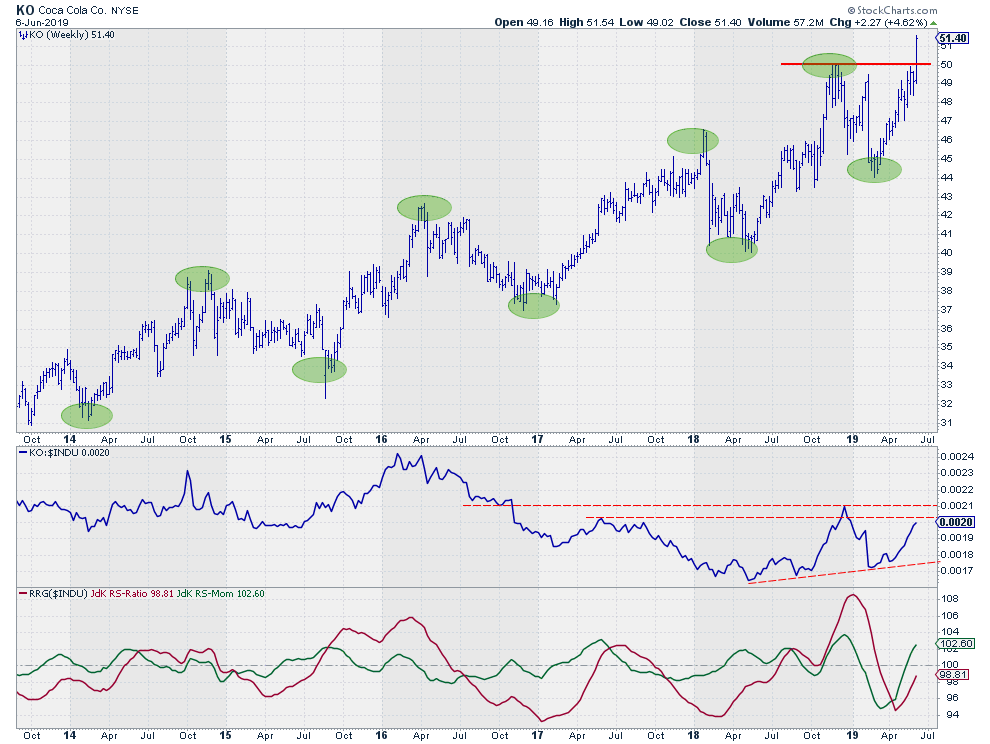
The price chart of Coca-Cola shows a series of higher highs and higher lows (green marked ovals), which means that an uptrend is in play. The only problem is that I had a hard time coming up with meaningful trend lines to mark that uptrend or contain it in a channel.
That's nothing major; it's just that the trend that is not as regular as we would like to see it. Higher highs and higher lows are good, though, and the recent break above the resistance level (around $50), coming off the last two (or three if you include the high of two weeks ago), has once again confirmed that this trend is still intact.
The relative line is a different story. From early 2016 until May 2018, KO was not able to keep up with the pace of the DJ Industrials index and was a big underperformer. This relative weakness changed during the second half of 2018; looking back, we can now detect two higher lows following the turning point in May 2018.
As a bonus, these three lows are lining up nicely, providing us with a reliable (three touch points) trend line to mark support for relative strength. A break beyond the two horizontal resistance lines (dashed) would be a confirmation of the improvement in relative strength that is underway and would provide the rally with new fuel.
The RRG-Lines are both moving higher at a pretty steep angle, providing us with the strong heading seen on the RRG. A further rotation into the leading quadrant seems to be around the corner.
McDonalds Corp - MCD
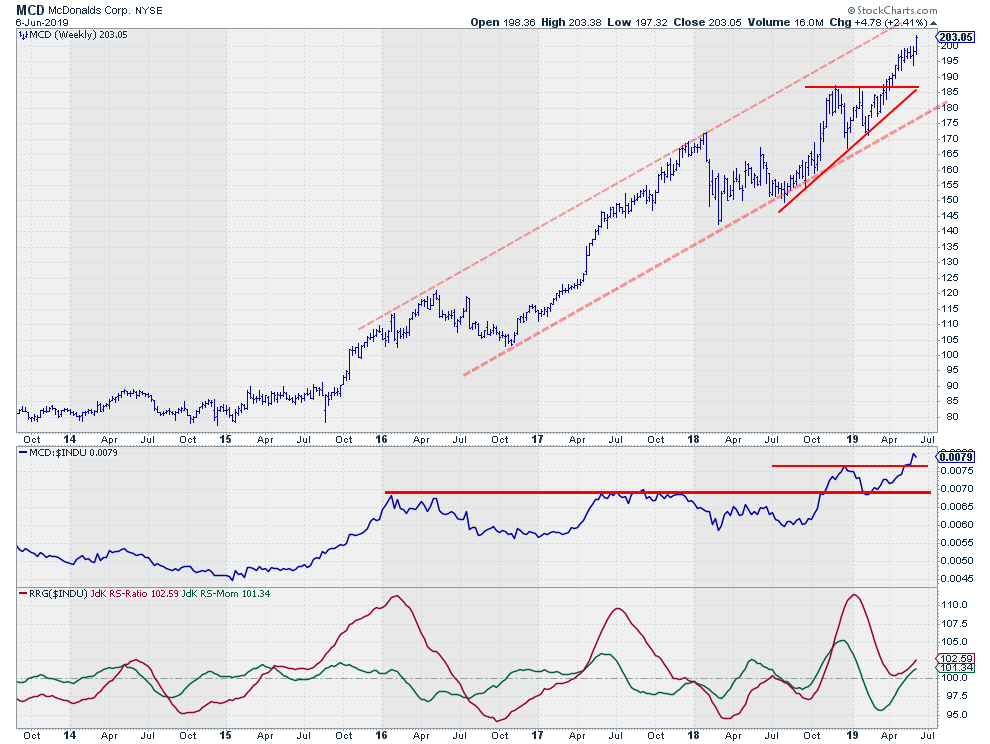
MCD is in even better shape than Coca-Cola. The price is contained inside a nice rising channel that is still in play and has room to move higher before touching the upper boundary. The recent break beyond resistance (just above $185) was a strong signal that triggered an acceleration of the rally that is currently underway.
From a relative perspective, MCD had been moving in a range since the start of 2016, only breaking out of it in October of last year. That initial break caused the RRG-Lines to move above 100 in tandem and position MCD inside the leading quadrant. After setting a new relative high, the former horizontal resistance level was successfully tested as support. During that test, the JdK RS-ratio line managed to remain above 100, putting in a new low before following relative strength higher.
This sequence of events causes a rotation at the right-hand side of the Relative Rotation Graph, which is usually a prelude to a strong relative move higher.
All in all, both stocks are looking good from a relative and price perspective in comparison to the DJ Industrials index.
So, at your next visit to MCD, you might want to consider super-sizing your meal (and adding an XL Coke). ;)
My regular blog is the RRG Charts blog. If you would like to receive a notification when a new article is published, simply Subscribe using your email address.
Julius de Kempenaer
Senior Technical Analyst, StockCharts.com
Creator, Relative Rotation Graphs
Founder, RRG Research
Want to stay up to date with the latest market insights from Julius?
– Follow @RRGResearch on Twitter
– Like RRG Research on Facebook
– Follow RRG Research on LinkedIn
– Subscribe to the RRG Charts blog on StockCharts
Feedback, comments or questions are welcome at Juliusdk@stockcharts.com. I cannot promise to respond to each and every message, but I will certainly read them and, where reasonably possible, use the feedback and comments or answer questions.
To discuss RRG with me on S.C.A.N., tag me using the handle Julius_RRG.
RRG, Relative Rotation Graphs, JdK RS-Ratio, and JdK RS-Momentum are registered trademarks of RRG Research.
