Viewers of MarketWatchers LIVE know how much I rely on my scans to find all those interesting symbols I review. In a ChartWatchers article last month, I shared my new favorite scan (Bullish EMA | Midrange SCTR), where I adjusted my time-tested "scan to rule them all" and found I could get better results by tweaking the SCTR and EMA configuration. In that mindset, I decided to try something new and use a "faster" PMO by changing the (35,20,10) parameters to (12,26,9). I run the scan using the fast PMO but analyze the results using the slower default PMO parameters.
I named this scan "Momentum Sleepers" based on the MWL segment that inspired it.
The results were quite good, but I do end up a large group (roughly 30 - 80) to sift through. (Sifting scans is another lesson; I have a video on YouTube that discusses how I sift my scans). It's interesting to see how many slower PMOs don't confirm the faster PMO results.
Here is the scan that combined a fast PMO with the slower default PMO.
[type = stock]
and [country is US]
//Not thinly traded
AND [Daily SMA(20,Daily Volume) > 100000]
//Less volatile stocks that close above $10
AND [Close > 10]
//PMO is "beat down" with a PMO that is negative (less than zero)
AND [Daily PMO Line(35,20,10,Daily Close) < 0]
//A "Fast" PMO that is on a BUY signal
AND [Daily PMO Line(12,26,9,Daily Close) >= Daily PMO Signal(12,26,9,Daily Close)]
//Fast PMO has been rising for three days
AND [Yesterday's Daily PMO Line(12,26,9,Daily Close) < Yesterday's Daily PMO Signal(12,26,9,Daily Close)]
AND [2 days ago Daily PMO Line(12,26,9,Daily Close) < 2 days ago Daily PMO Signal(12,26,9,Daily Close)]
AND [3 days ago Daily PMO Line(12,26,9,Daily Close) < 3 days ago Daily PMO Signal(12,26,9,Daily Close)]
I ran this scan and, as of publishing, got 31 results.
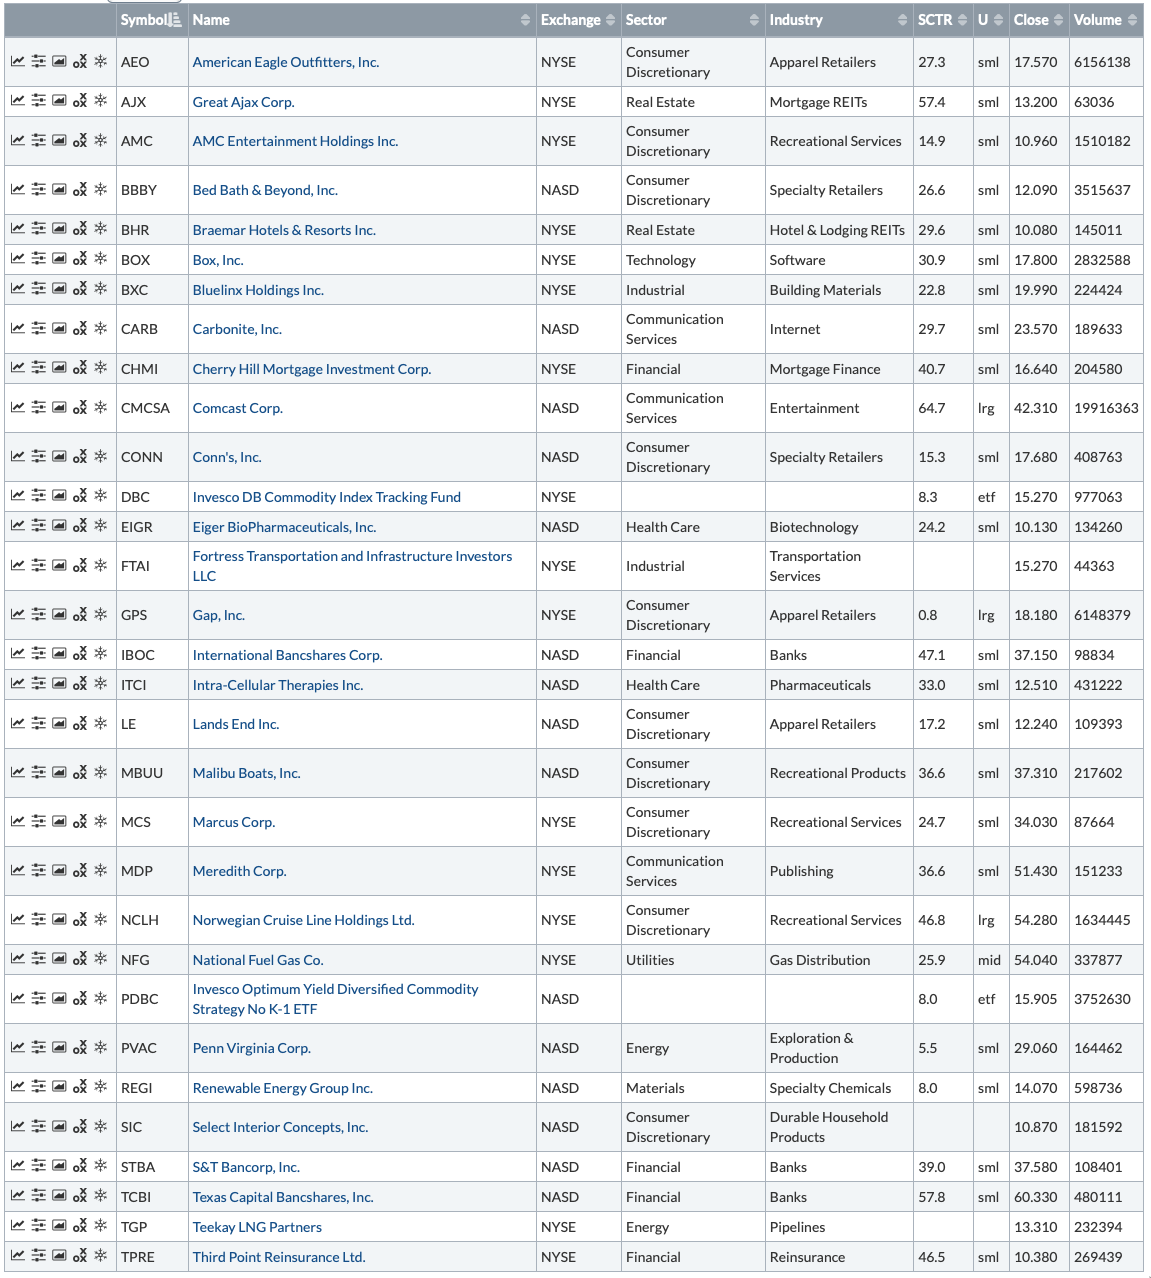
That's a lot to sift through, but I find that using my unique CandleGlance ChartStyle makes sifting much easier. While I use the faster PMO to get candidates, I use my slower PMO to analyze as it fits better in my intermediate-term investing style.
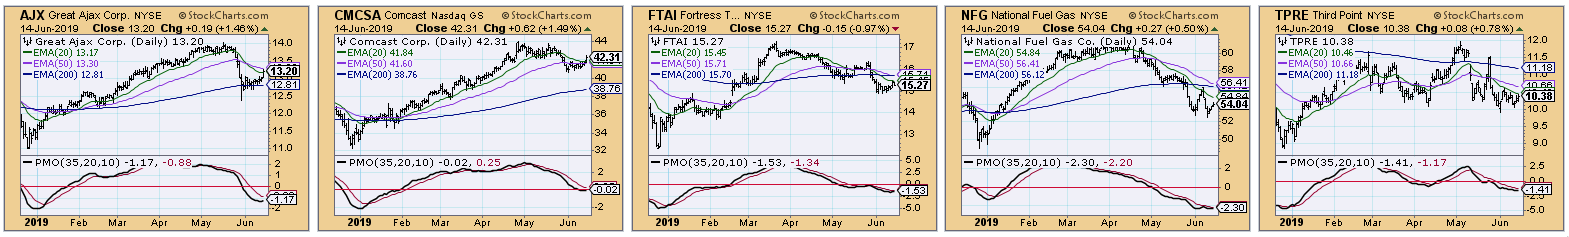
Here's a snapshot of the symbols that I liked out of the results above. (Remember, you can have a unique CandleGlance by saving the ChartStyle as "CandleGlance.") But why did I like them?
The double-bottom that is forming on NFG looks very promising. I would be interested in potentially getting on board before the move to test the confirmation line; doing so would also put me in a good position should the pattern execute. The others have consolidation zones with recent breakouts, and three (AJX, CMCSA and FTAI) have possible ascending triangles. TPRE is consolidating. It has bounced back off support and is ready to challenge resistance with a PMO that is ready to turn. If I had to pick just one, I think AJX has the most promise, closely followed by CMCSA.
Conclusion: I've found that using a faster PMO for scanning while reviewing using the slower PMO gives you new insight. We know based on the scan that the faster PMO has uncoiled and given a BUY signal. In essence, the momentum is building underneath. The slower PMO can confirm what the faster PMO is suggesting and give you better candidates overall.
Watch the latest episode of DecisionPoint with Carl & Erin Swenlin LIVE on Fridays 4:30p EST or on the StockCharts TV YouTube channel here!
Technical Analysis is a windsock, not a crystal ball.
Happy Charting!
- Erin
erinh@stockcharts.com
Helpful DecisionPoint Links:
DecisionPoint Shared ChartList and DecisionPoint Chart Gallery
Price Momentum Oscillator (PMO)
Swenlin Trading Oscillators (STO-B and STO-V)
**Don't miss DecisionPoint Commentary! Add your email below to be notified of new updates"**
