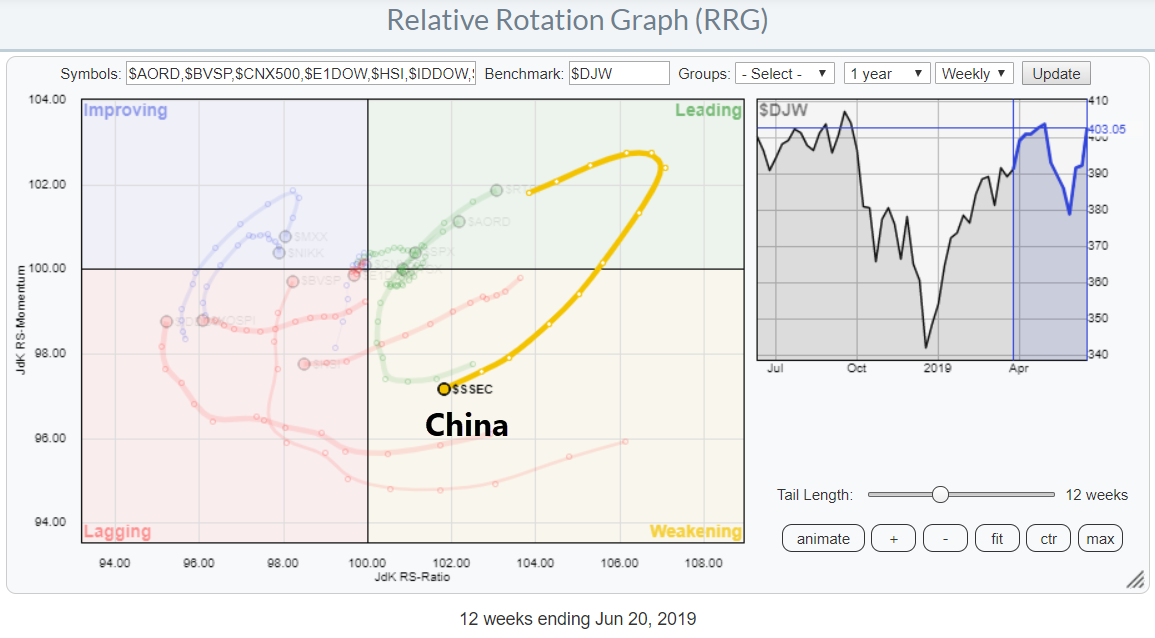
 On the above Relative Rotation Graph, which shows the rotation for international stock indexes against the Dow Jones World index, we really ought to pay attention to the long tail inside the weakening quadrant for the Chinese market.
This rotation follows a strong performance of the Chinese market during the first four months of the year, which was followed by a 50% correction. At the moment, $SSEC is putting a first higher low into place, which could offer good entry opportunities.
China
Regarding China, the big question will be if that market can curl back up towards and into the leading quadrant and subsequently complete a rotation at the right-hand side of the RRG.
The weekly chart below of the Shanghai Stock Exchange Composite Index ($SSEC) gives us a few good clues.
Weekly
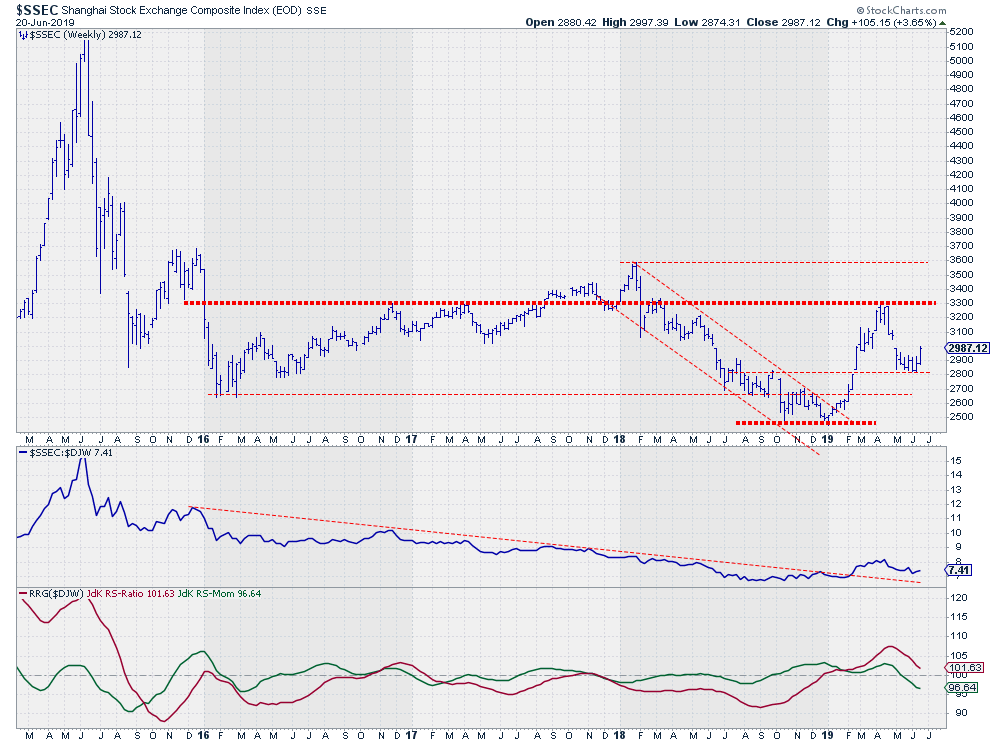 The downtrend that characterized 2018 bottomed out towards the end of that year and going into 2019. By January and February, $SSEC managed to break the falling resistance line and complete a double bottom formation, breaking above the November high around 2700. The rally that followed out of that bottom took prices back to 3300, where they hit a horizontal level that had acted as support and resistance on a few occasions since 2016.
Another sign of strength occurred when the decline from that test of resistance resulted in a new higher low at 2800.
This week, the Chinese market is working its way higher out of that newly formed low, which is more visible on the daily chart.
Daily
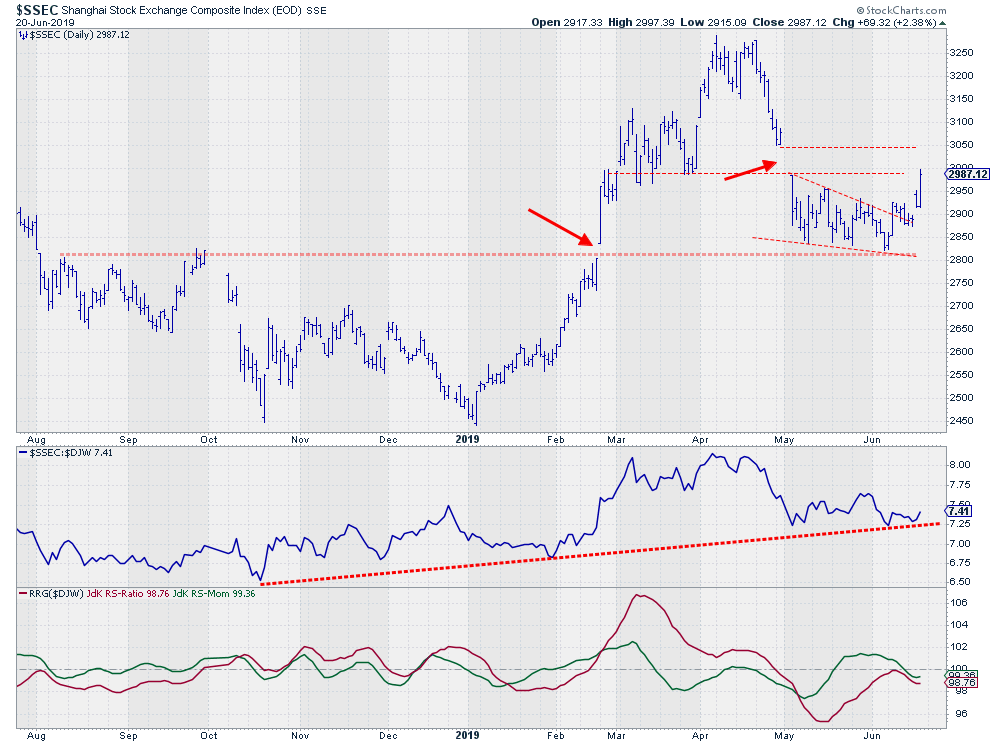 The detail on this daily chart also shows that the forming of support near 2800 took place at a level that played a role a few times before in 2018, including a small gap in February of this year. At the moment, $SSEC is entering the gap resistance area between 3000-3050. Clearing that barrier will be another sign of strength and is necessary for the $SSEC to extend current strength in a more meaningful rally.
In terms of relative strength, the market is holding up well above support. On the weekly chart, $SSEC is holding up above the former falling resistance line. On the daily chart, the rising support line, starting at the October 2018 low, is getting stronger and stronger.
The RRG-Lines on the weekly chart need to start turning upward soon in order to keep $SSEC at the right-hand side of the RRG and, consequently, push this market back into the leading quadrant.
On the daily RRG, China is inside the lagging quadrant following the recent flat-to-weakening relative strength, but has just turned back up into a positive RRG-Heading. When relative strength can hold up above current support, the daily tail should be able to continue towards the improving and leading quadrants in the near future. The speed at which such a turn occurs will influence the ability for $SSEC to complete the turn on the weekly chart without going through lagging.
All in all, the current outlook for the Chinese market, compared to other international stock markets, is still strong, but the improvement that is now visible should continue in coming weeks in order to keep this outlook alive.
This setback following a long-term turnaround seems to be offering a relatively low-risk entry point to participate in a potential new rally for Chinese stocks, at least on a relative basis.
My regular blog is the RRG Charts blog. If you would like to receive a notification when a new article is published, simply Subscribe using your email address.
Julius de Kempenaer
Senior Technical Analyst, StockCharts.com
Creator, Relative Rotation Graphs
Founder, RRG Research
Want to stay up to date with the latest market insights from Julius?
– Follow @RRGResearch on Twitter
– Like RRG Research on Facebook
– Follow RRG Research on LinkedIn
– Subscribe to the RRG Charts blog on StockCharts
Feedback, comments or questions are welcome at Juliusdk@stockcharts.com. I cannot promise to respond to each and every message, but I will certainly read them and, where reasonably possible, use the feedback and comments or answer questions.
To discuss RRG with me on S.C.A.N., tag me using the handle Julius_RRG.
RRG, Relative Rotation Graphs, JdK RS-Ratio, and JdK RS-Momentum are registered trademarks of RRG Research.
