Editor's Note: This article was originally published in John Murphy's Market Message on Friday, July 26th at 11:16am ET.
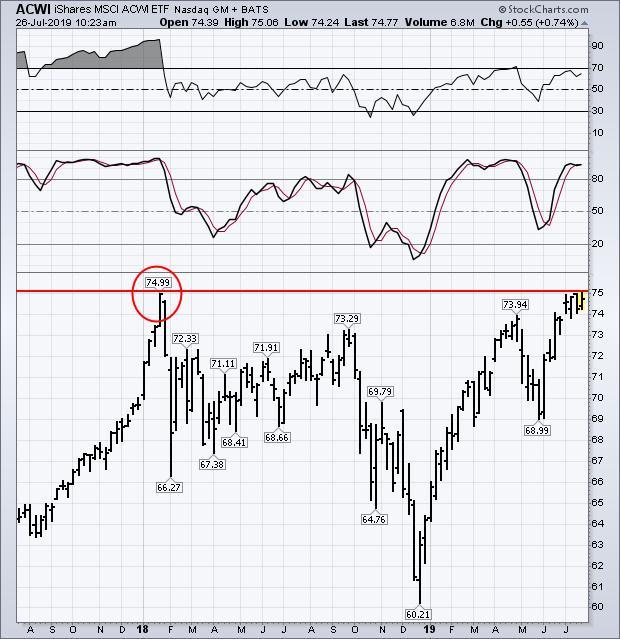
Global stock indexes are once again testing overhead resistance barriers. The weekly bars in Chart 1 show the MSCI All Country World Index iShares (ACWI) in the process of testing its previous high set at the start of 2018 (see red circle). Any test of a prominent previous peak always bears close watching. Weekly momentum indicators also suggest a potential overbought condition.
The 9-week RSI line (top box) is nearing overbought territory at 70. While the 14-week slow stochastics oscillator (middle box) is already well into overbought territory over 80. That doesn't mean that the ACWI won't clear its 2018 peak. It just means that global stocks have another chart barrier to overcome. More than half of the ACWI (56%) is comprised of U.S stocks (which have already hit new highs). Foreign stocks (which are lagging way behind the U.S.) are holding it back.
Chart 1