Editor's Note: This article was originally published in Martin Pring's Market Roundup on Wednesday, August 21st at 9:36pm ET.
During my many decades in this business, I have never heard of a recession so well-advertised as the one we are witnessing currently. It's a fact that financial market events that are widely expected rarely take place; someone who knows a train is on the way is almost certain to get off the tracks ahead of time. So it goes in the financial markets. If you think a recession is coming, you sell. Why stay around for the carnage? From a contrarian point of view, the fact that the market has held up so well is very bullish. More to the point, positive market action is starting to be reflected in the charts.
Chart 1 could look pretty scary if the MSCI World ETF (ACWI) were to break below the $70 level, as that would complete a nasty-looking potential head-and-shoulders top. That $70 zone takes on added importance as the 200-day MA is in the same area. Right now, the average is completely covered by the trend line, indicating a very formidable support barrier. In order to obtain some indication of how significant a particular MA timespan might be, it's a good idea to visually review its support/resistance qualities in the past. In this instance, the 200-day period has been pretty impressive, as you can see from the numerous small blue arrows. The $70 area is therefore a must-hold one. However, current technical evidence suggests that it is unlikely to be breached. One reason I say that is the oversold nature of my Global A/D Line price oscillator. The chart shows that, when it has reached an overstretched level in the past and reversed to the upside, some form of rally has usually followed. Currently, it is declining, so we can't yet say that another buy signal has been triggered. However, we can see some green shoots from the US market, which is where global upside leadership is currently coming from.
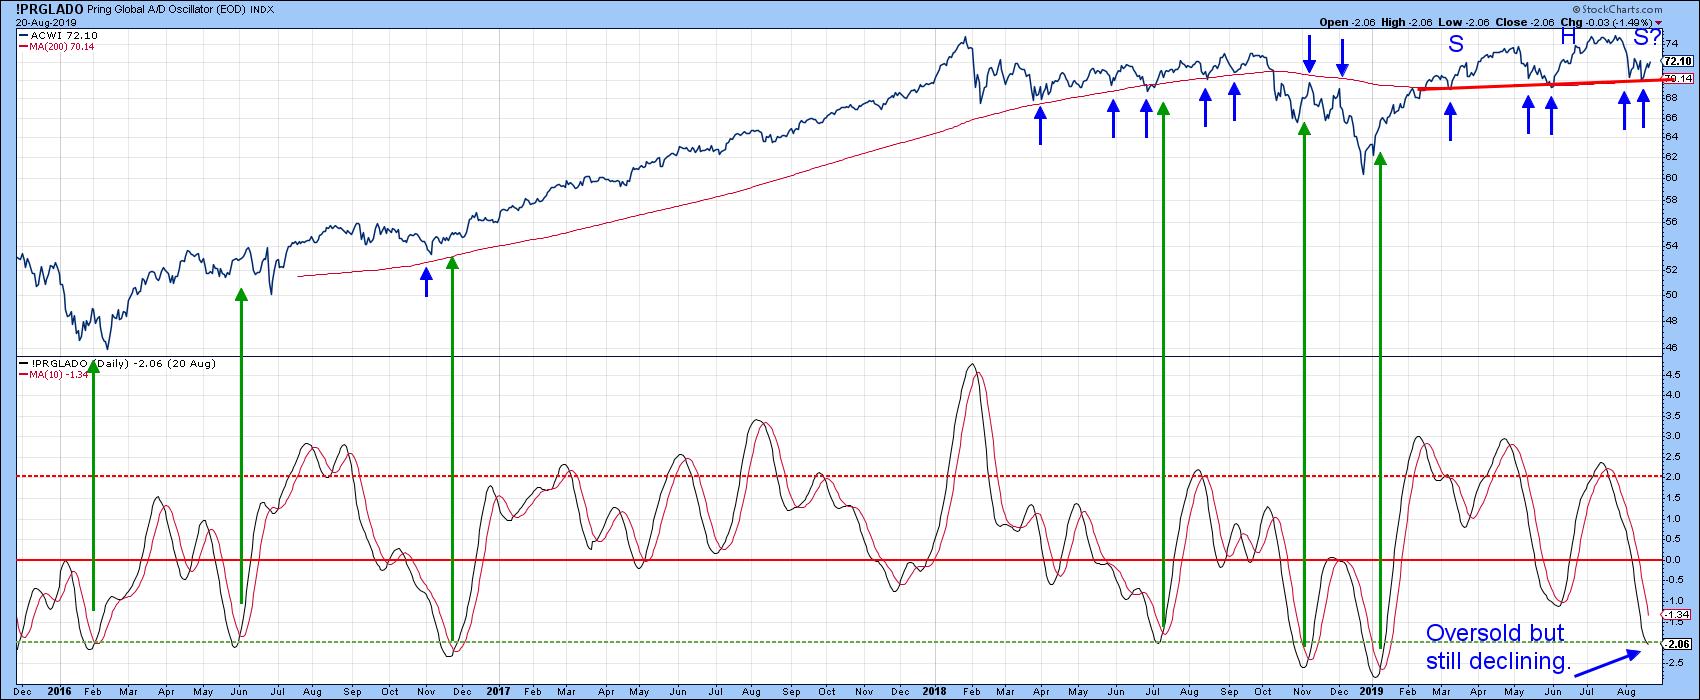
Chart 1
Good luck and good charting,
Martin J. Pring
The views expressed in this article are those of the author and do not necessarily reflect the position or opinion of Pring Turner Capital Group of Walnut Creek or its affiliates.
