This week, China agreed to continue negotiations on the China-US trade deal. While that is news that the market can look forward to seeing play out, it definitely helped the charts technically.
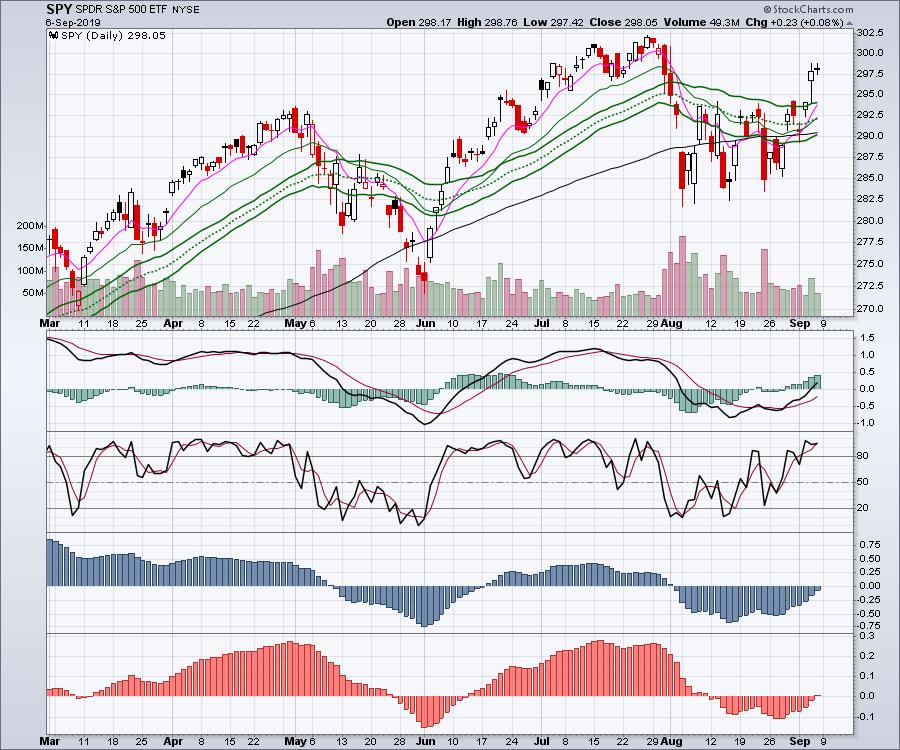
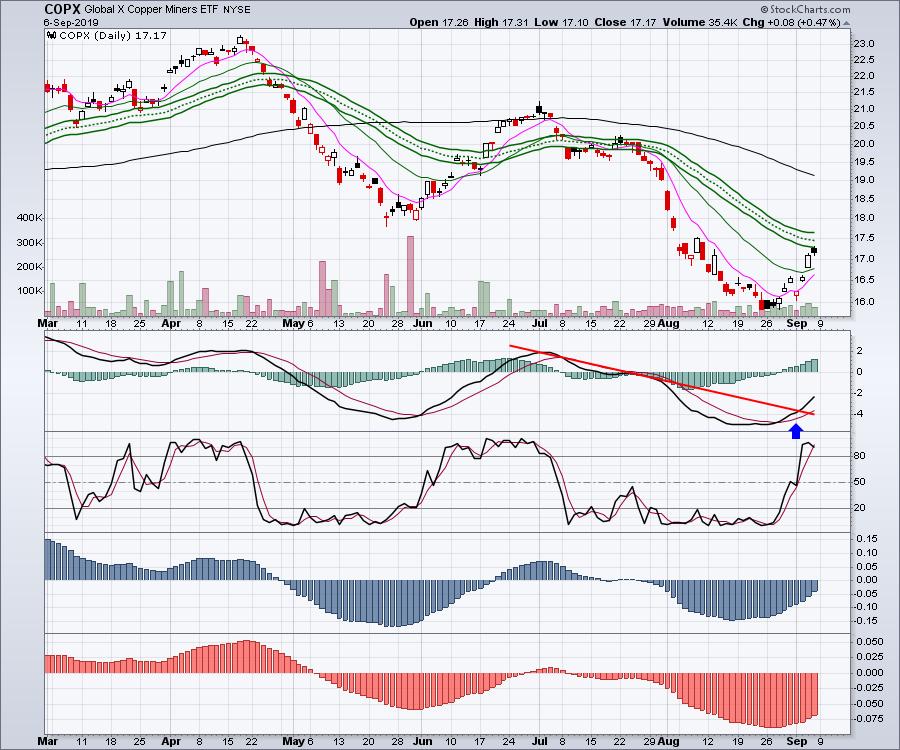
Thus, the indexes look set to take a run at the nearby highs. But the areas of the markets that I am looking at are the Industrial metals and Rare Earth metals. The chart below represents copper miners.
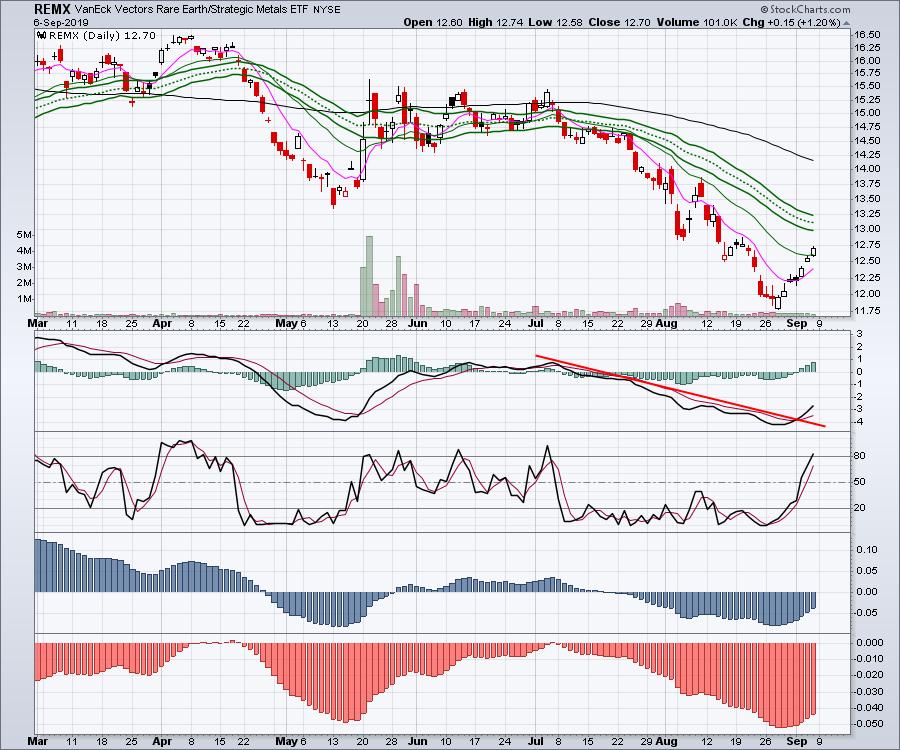
The rare earth metals chart didn't kick off as strong on the news, but, if we start to see some growth in trade, this area should perk up nicely.
Recognizing that these charts are bouncing off two-year lows, we can see they also topped out when tariff announcements started in early 2018. Check out the 3-year charts below.
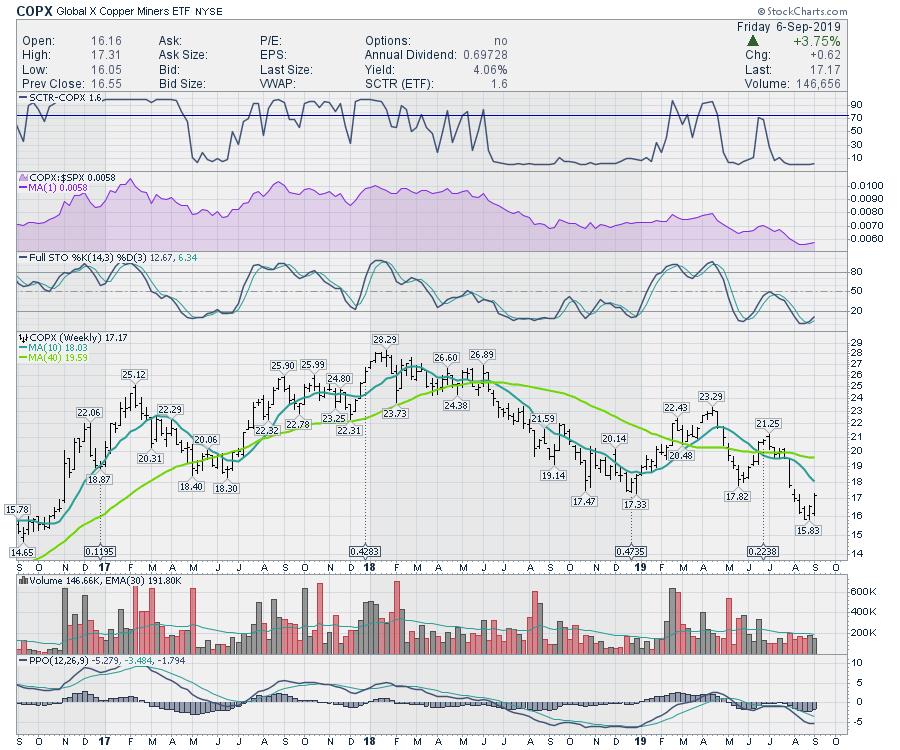
Here is the REMX weekly.
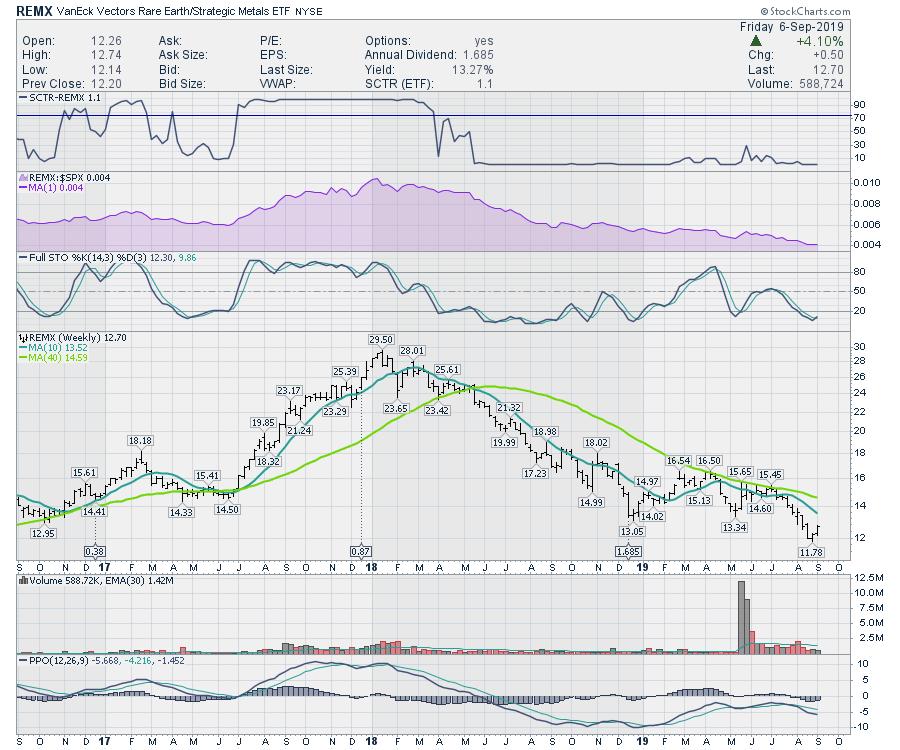
Notice there is significantly higher PPO lows currently on the weekly charts than the December 2019 lows. Stay tuned to see if these charts can fly! What is the x-factor? The tickers copX and remX are both worth watching, as these ETFs should move significantly faster than the metals.
Good trading,
Greg Schnell, CMT, MFTA
Senior Technical Analyst, StockCharts.com
Author, Stock Charts For Dummies
Want to stay on top of the market's latest intermarket signals?
– Follow @SchnellInvestor on Twitter
– Connect with Greg on LinkedIn
– Subscribe to The Canadian Technician
– Email at info@gregschnell.com
