 Very soon, I will be launching a daily newsletter for DecisionPoint that will give you some stocks that have presented themselves in one of my many DecisionPoint scans. I do the analysis so you don't have to. I don't make trading recommendations, and certainly no promises - I just do the legwork and find the stocks I think you should look at.
I decided that I would do my first scan report for our ChartWatchers readers. Keep an eye out later this month for more information on the launch of this new service from DecisionPoint.
Today I ran my "General PMO Scan" after the market closed. (You'll find the scan language at the end of the article.) From the results, I've picked my five gems for the day. Again, it is important that you do your own analysis. When this newsletter launches, I'll be posting five gems five days a week!
These results are in alphabetical order.
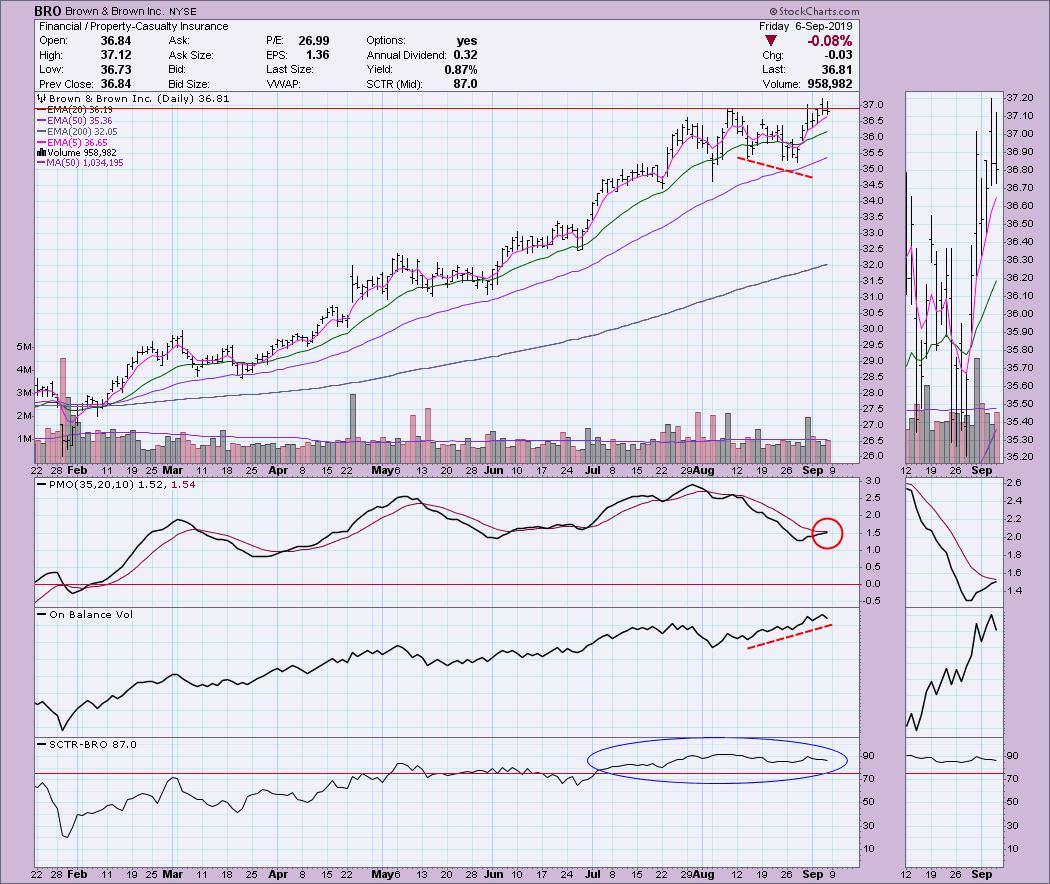
BRO was an interesting one. As far as price, it did break out, but hasn't been able to maintain above the resistance level. However, note that the OBV has a positive divergence that activated on the recent rally. Since then, the OBV has continued to climb with price. The PMO is about ready to give us a positive crossover BUY signal. The SCTR has been the "hot zone" above 75 for quite some time, indicating that there is internal strength.
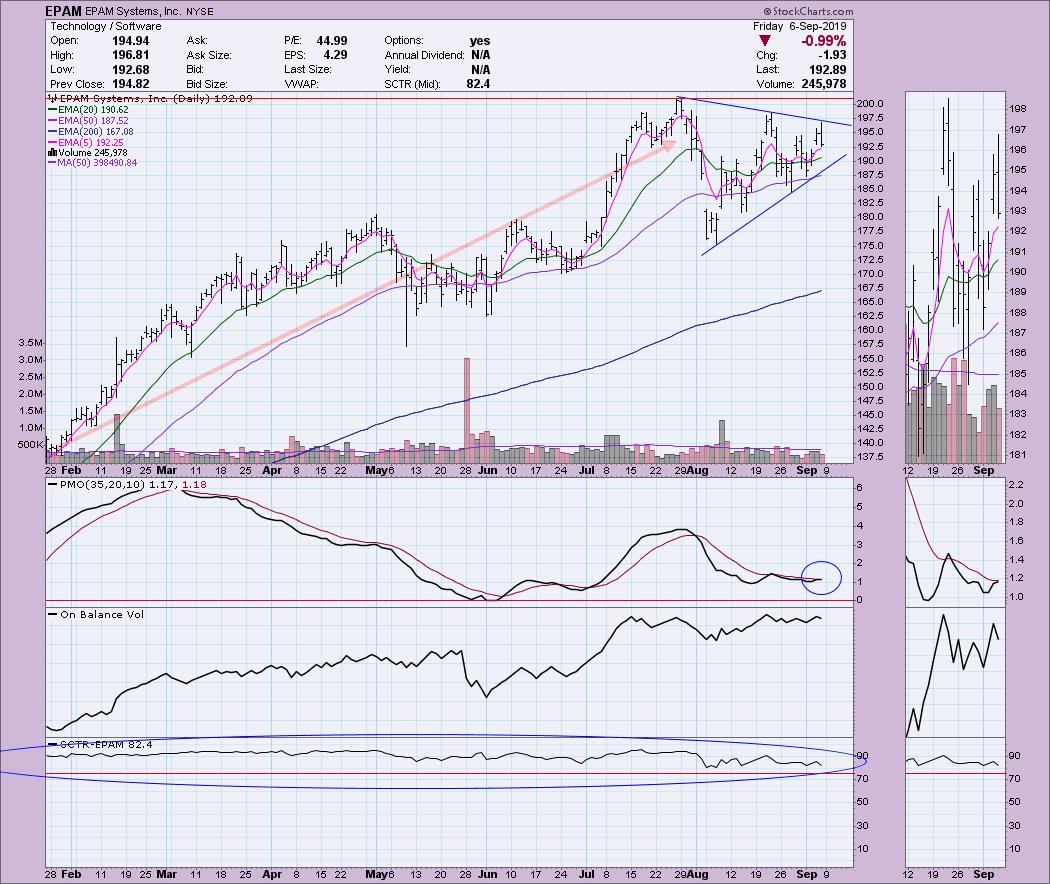
EPAM was very interesting to me. No doubt it has been experiencing some difficult volatility alongside the market, but it has now formed a symmetrical triangle. These are continuation patterns, which means they should break in the direction of the leading trend. As you can see, EPAM overall was in a rising trend. The PMO is attempting to trigger a BUY signal. I like to find candidates that are beginning to make their move, so that most times they won't already have that crossover BUY signal. The PMO turned up above the zero line, which is a plus. I also like the SCTR. Despite the ups and downs, EPAM has held up with the SCTR above 75 within this charting period. Yesterday saw a big upside move; today, it pulled back. I'm watching for an upside breakout.
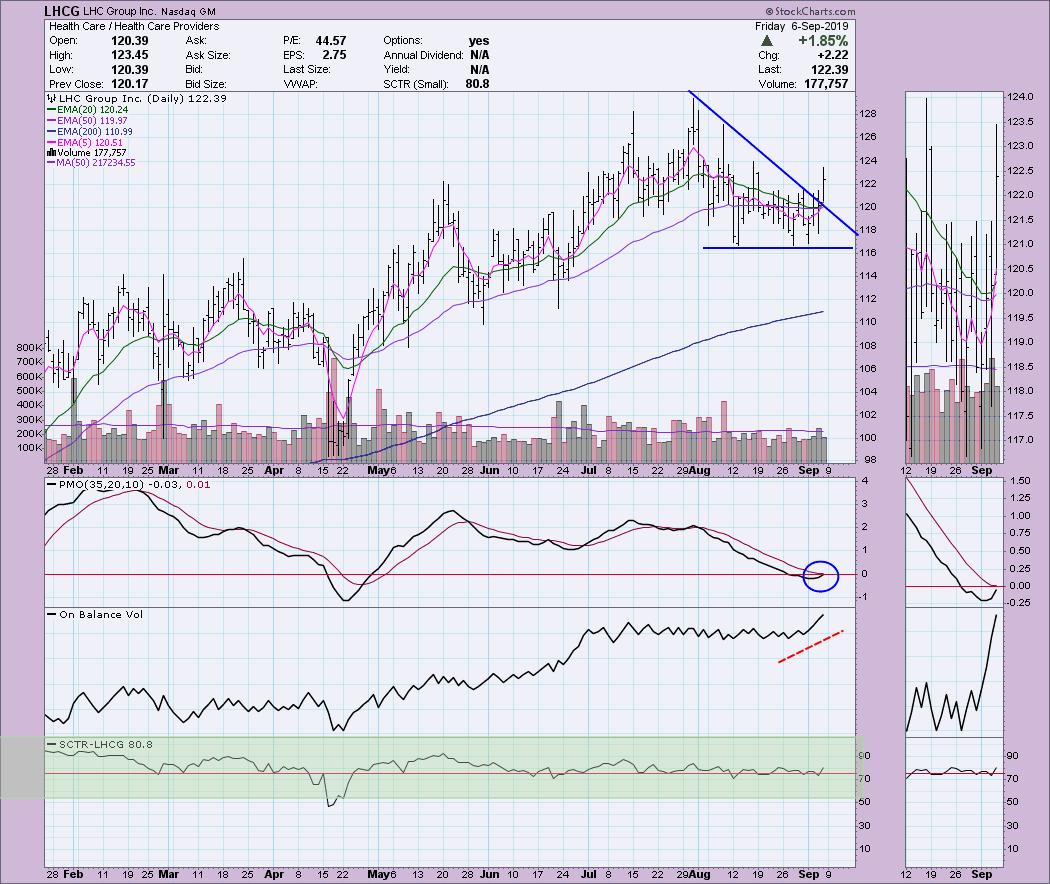
LHCG had formed a bearish descending triangle, but today it resolved to the upside. I always find a bullish resolution to a bearish pattern especially bullish. The 20-EMA avoided a negative crossover. Today, the 5-EMA crossed above the 20-EMA for an ST Trend Model BUY signal.
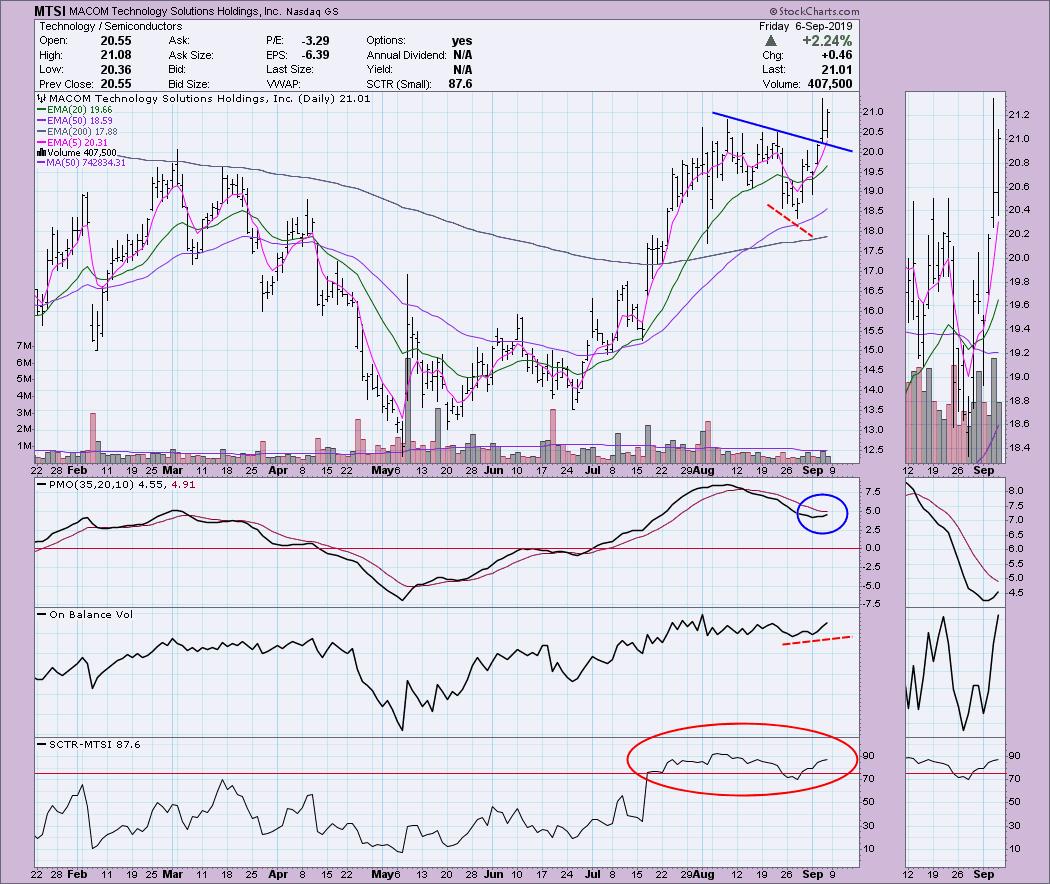
MTSI had a fabulous day with a continuation of yesterday's breakout, closing near the top of the range. The OBV had a positive divergence with price, which resolved as expected with a price rally. You may want to hold out for a pullback after today's rally, but, many times, the good ones will continue to run. The PMO is turning up above the zero line and is not really in overbought territory.
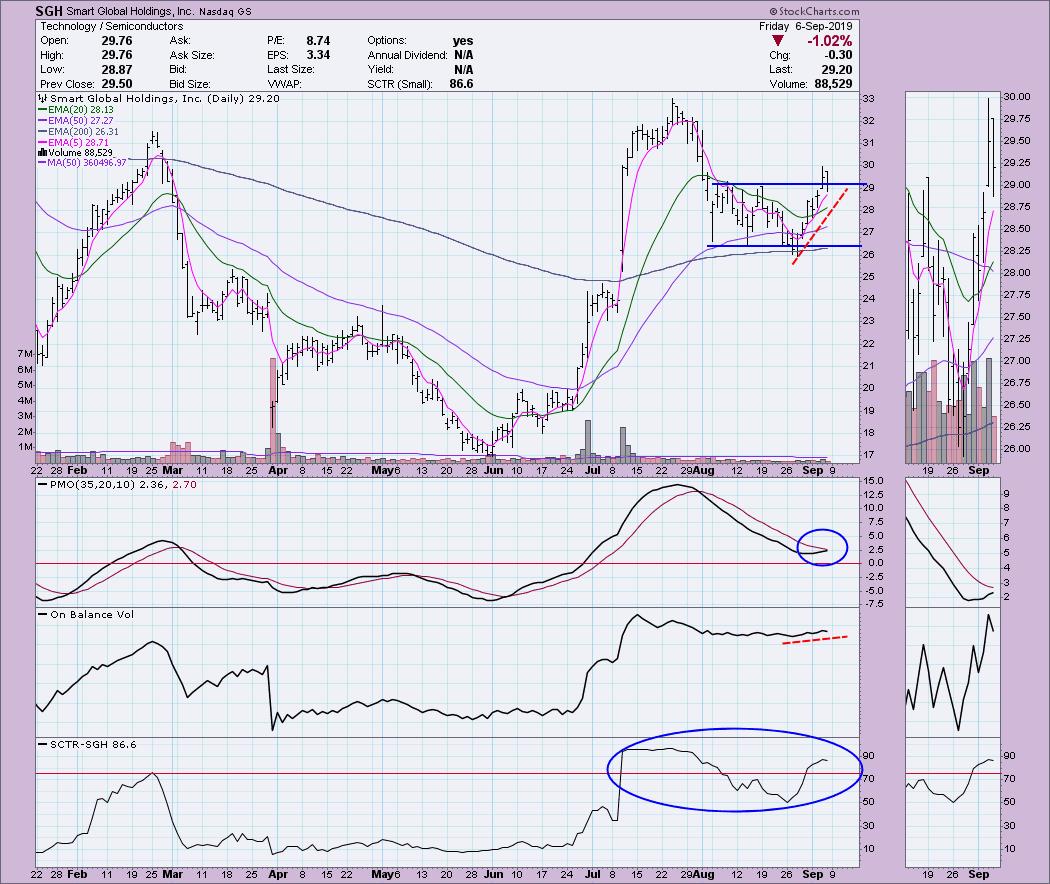
SGH has been in a trading range for most of August. Yesterday, we saw a breakout; today, we got the pullback. While it was a move 1% lower, the rising trend is completely intact and the OBV is confirming the current rally.
I hope you enjoyed reading about these gems. Again, I'll remind you that I am not making trading recommendations. When I start publishing this newsletter, I will also give complete disclosure as to whether I own or plan to purchase any of the stocks that I show you.
General PMO Scan:
// Narrows down the universe to stocks with decent volume and from the US
[type = stock] AND [Daily SMA(20,Daily Volume) > 100000]
AND [country is US]
// Keeps the penny stocks and high volatility stocks out of your results
AND [Close > 10]
// This identifies a PMO that hasn't yet had a positive crossover its signal line
AND[today's PMO Line(35,20,10) < today's PMO Signal(35,20,10)]
// This identifies a PMO rising for three days
AND [today's PMO Line(35,20,10) > yesterday's PMO Line(35,20,10)]
AND [yesterday's PMO Line(35,20,10) > 2 days ago PMO Line(35,20,10)]
AND [2 days ago PMO Line(35,20,10) > 3 days ago PMO Line(35,20,10)]
//This ensures we get a positive IT and LT Trend Model configuration
AND [today's ema(20,close) > today's ema(50,close)]
AND [today's ema(50,close) > today's ema(200,close)]
//This identifies stocks with SCTRs greater than 75 or in the "hot zone"
AND [SCTR > 75]
Watch the latest episode of DecisionPoint with Carl & Erin Swenlin LIVE on Mondays 5:00pm EST or on the StockCharts TV YouTube channel here!
Technical Analysis is a windsock, not a crystal ball.
Happy Charting! - Erin
erinh@stockcharts.com
Helpful DecisionPoint Links:
DecisionPoint Shared ChartList and DecisionPoint Chart Gallery
Price Momentum Oscillator (PMO)
Swenlin Trading Oscillators (STO-B and STO-V)
**Don't miss DecisionPoint Commentary! Add your email below to be notified of new updates"**
