The Dollar Index has been rising in the last few sessions following its December decline, which has put it at a crucial technical juncture. Whichever way it breaks will have implications for commodities, gold and the relative performance of international equities to the US. A rising currency would have negative effects on all three, whereas a falling one would represent a bullish factor for them.
Chart 1, for instance, shows that the Index is above its 24-month MA. Historically, this MA has acted as a reliable dynamic level of support and resistance. You can see that from the various green and red arrows, which have turned back numerous rallies and reactions in the last 25 years or so. Also worth noting is the fact that the red neckline of a potential head-and-shoulders top is just a tad above the 24-month MA. That means that a decisive month-end close below that average, at 95.73, would likely tip the balance of the long-term evidence to the bearish side.
Another aspect of the chart lies in the fact that the 9-month RSI bounced off an oversold condition at the start of 2018, which is characteristic of a primary bull market. Since then, it has failed to register an overbought reading that would be consistent with bull market behavior for this indicator. Just compare recent action with that which occurred between 1997-2001, when the RSI consistently and persistently maintained an overbought condition, and you'll see what I mean. Current action, by contrast, looks to be more characteristic of a bear market or trading range.
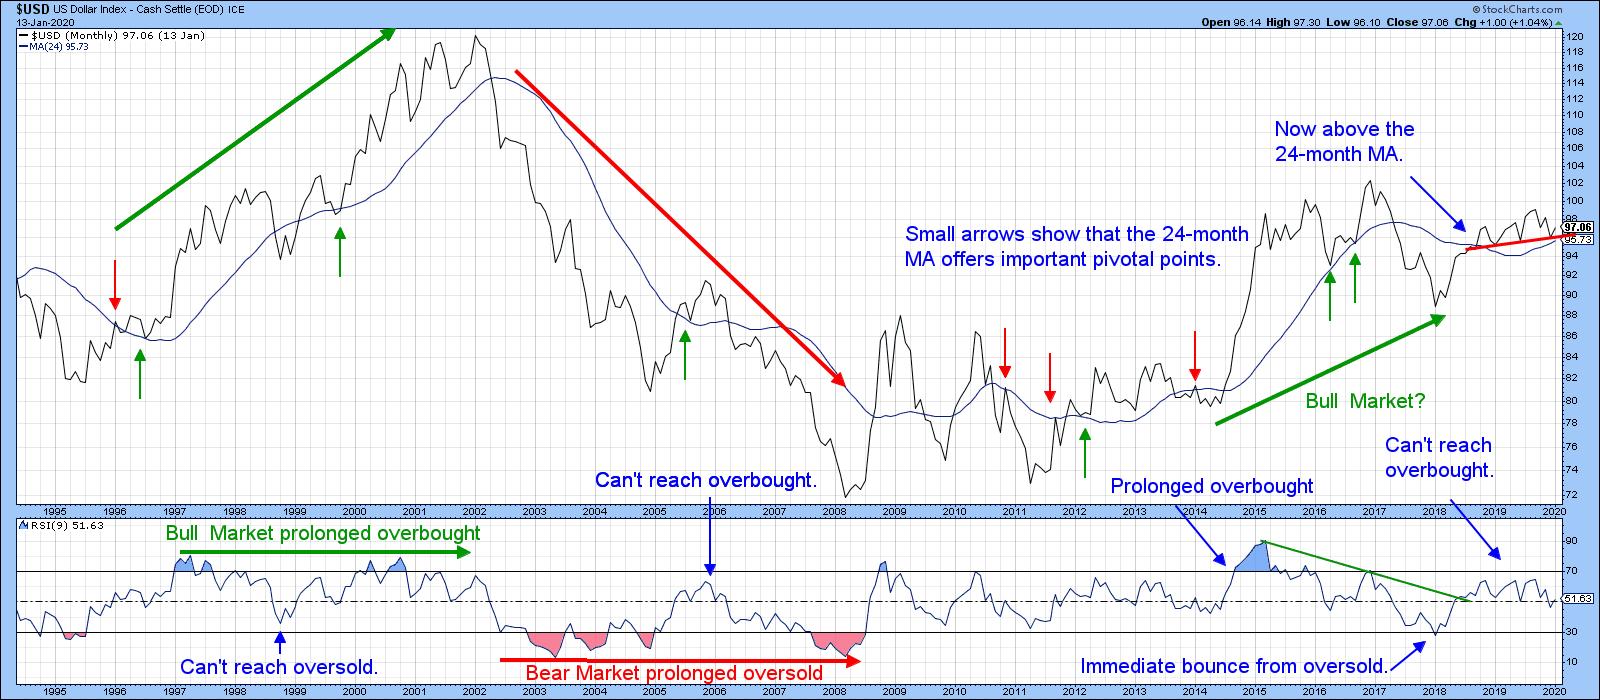
Chart 1
Chart 2 offers a mixed picture. The Index is below its 12-month MA, but the KST is comfortably above its MA.
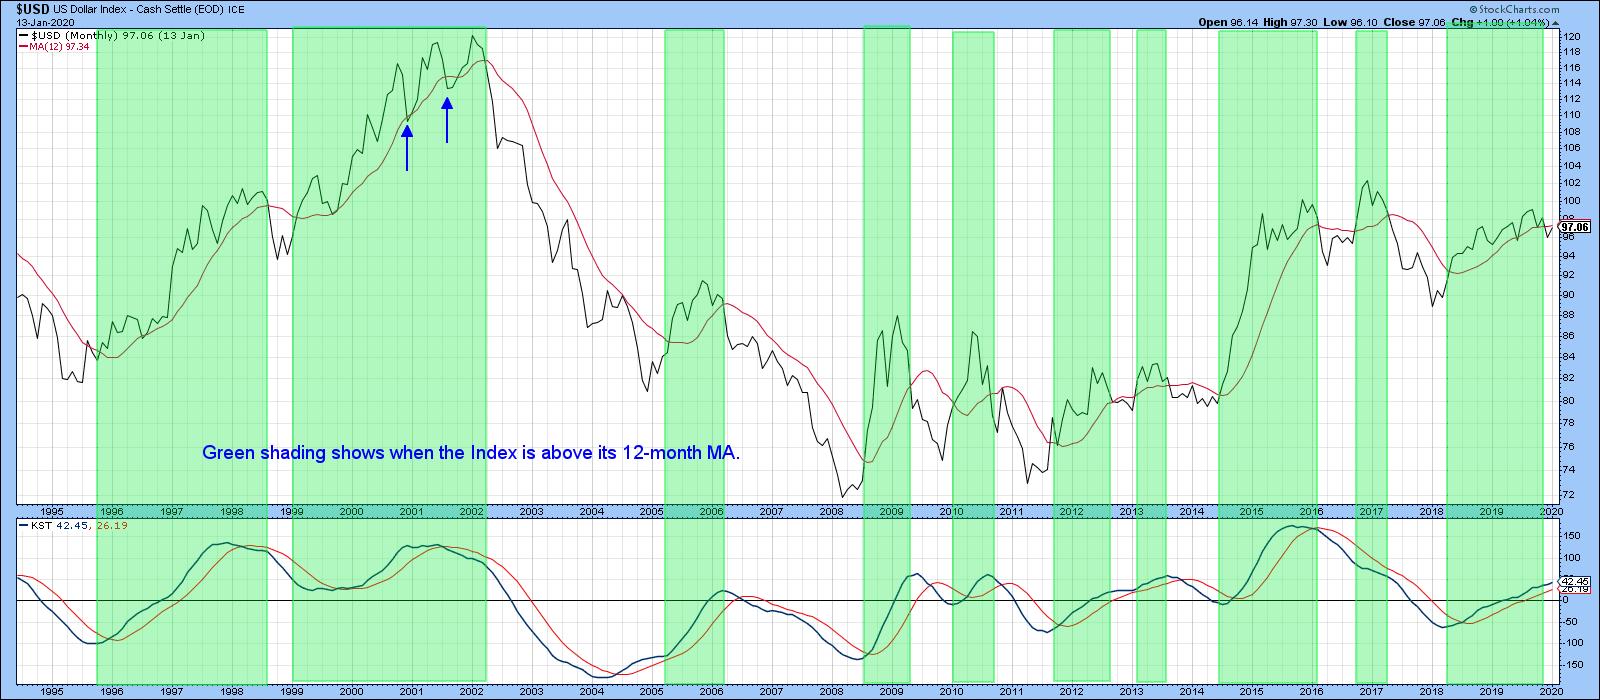
Chart 2
Chart 3 utilizes daily data and compares the Index with my currency diffusion indicator (!PRDIFCUR). This series monitors a universe of cross-dollar rates that are in a positive trend. The green arrows point up periods when it has reversed from an oversold reading. Usually, such events are followed by a dollar rally of some kind. When the Index is in a primary bear market, signals tend to be weaker. This is evident from the action in the pink-shaded area. Right now, the indicator is oversold but still declining. That means it could be close to a buy signal, unless the currency is in a bear market, where prices are far less sensitive to oversold conditions. We can also see that the blue 50-day MA has reached the oversold zone. Previous instances have been flagged by the small dashed-green arrows. Here again, this kind of event has triggered a rally when the primary trend has been bullish, but not so when it has been bearish.
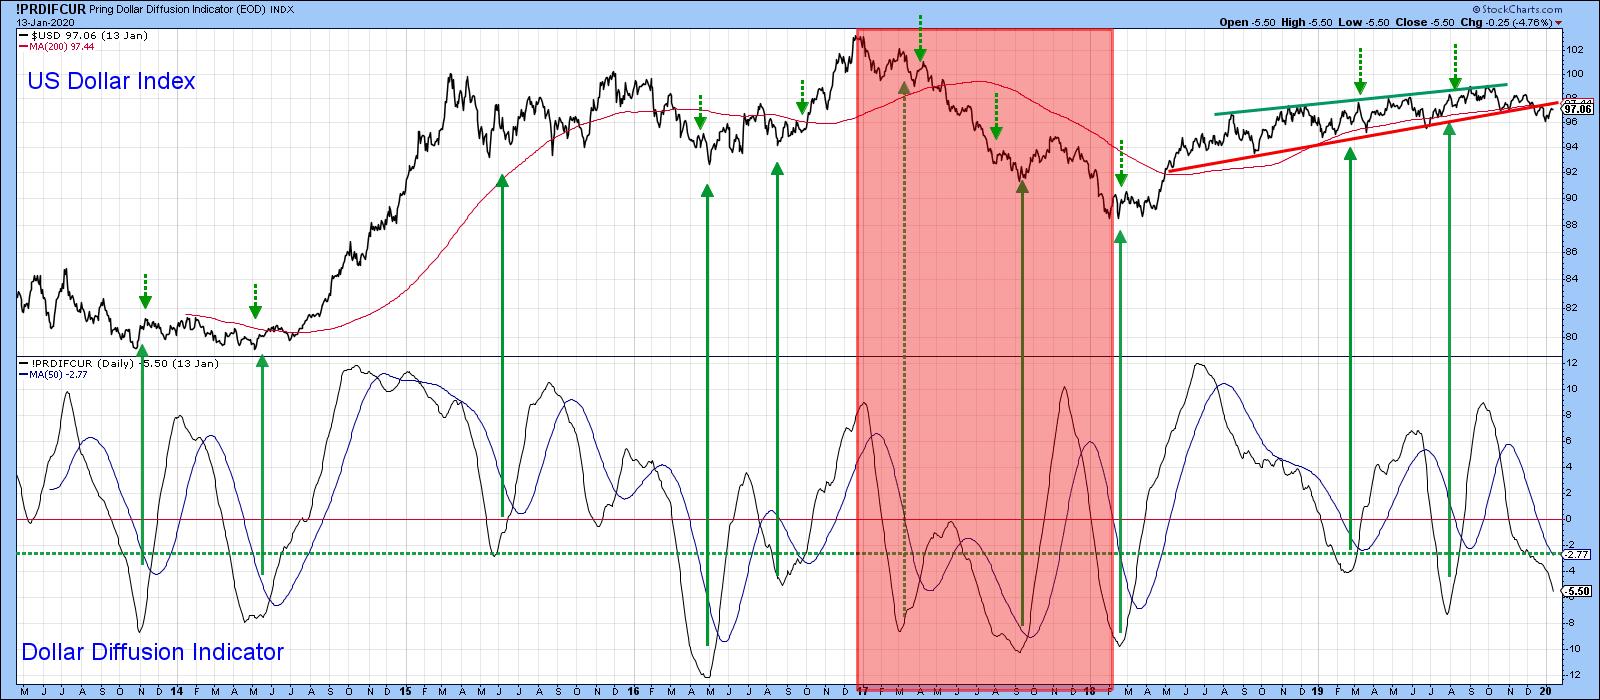
Chart 3
Editor's Note: This is an excerpt of an article that was originally published in Martin Pring's Market Roundup on Tuesday, January 14th at 3:47pm ET. Click here to read the full article, which includes Charts 4-5 and further discussion on Chart 3.
Good luck and good charting,
Martin J. Pring
The views expressed in this article are those of the author and do not necessarily reflect the position or opinion of Pring Turner Capital Group of Walnut Creek or its affiliates.
