These charts are some of the highlights of The Canadian Technician webinar on Tuesday, November 24th. That webinar can be seen by following this link. The Canadian Technician 20151124.
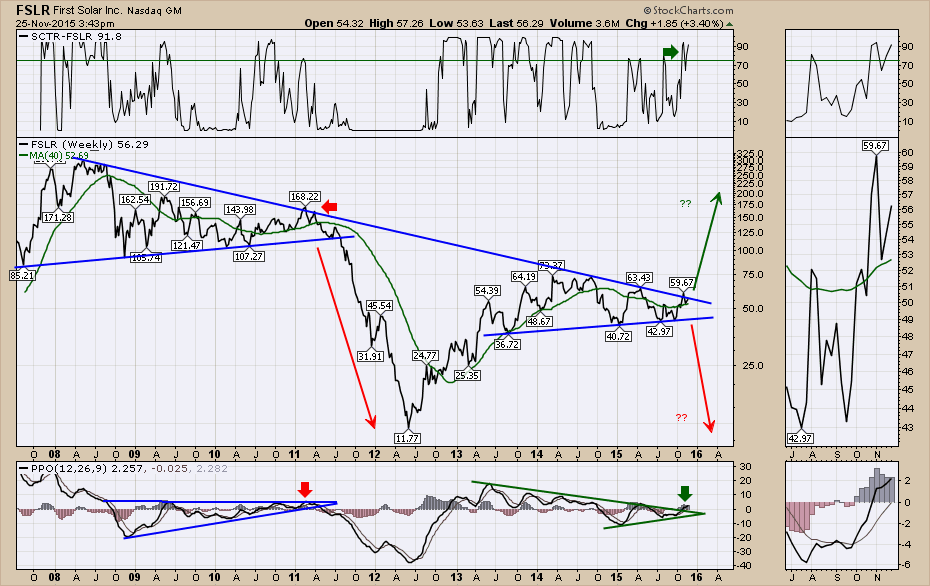
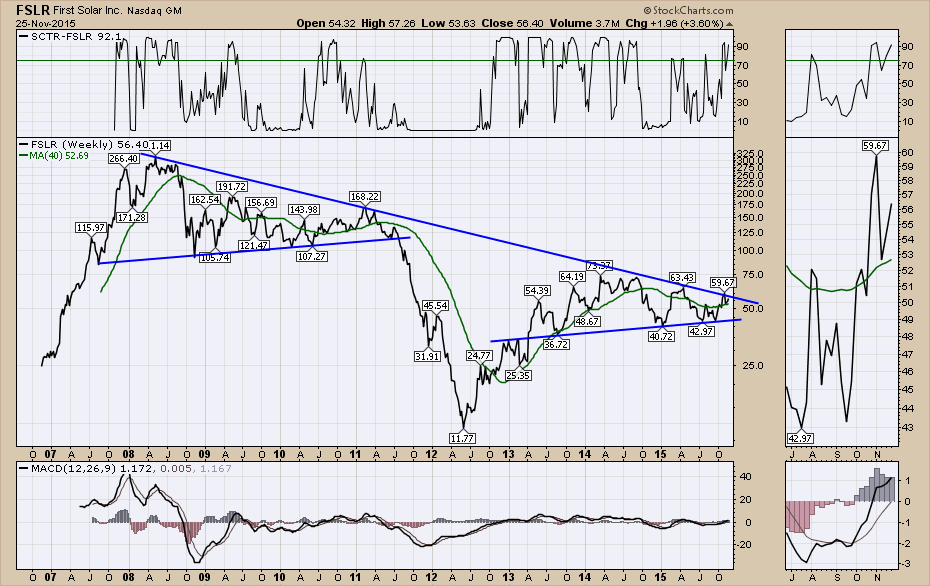
During the presentation, I made a case that some of the solar charts are pushing up against long-term downtrend lines and this is an important time to watch. An example would be First Solar (FSLR).
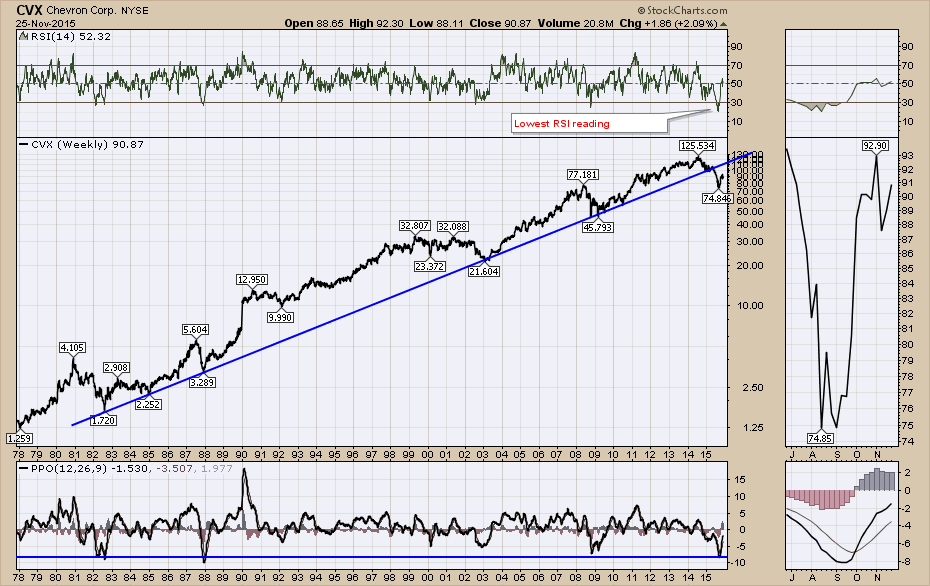
However, one of the other trends that have shown up on long term trend lines is the breakage of very long term trends on the large cap oil stocks. Hat tip to Martin Pring for pointing this Chevron (CVX) chart out to me. This breaks a trend line that held up through 2 Gulf wars and through the oil prices of the low teens in the late 1990's and 1986. To have it show up after the great financial crisis adds concern, but on a wider note, when something breaks a major uptrend, we should study the broader implications.
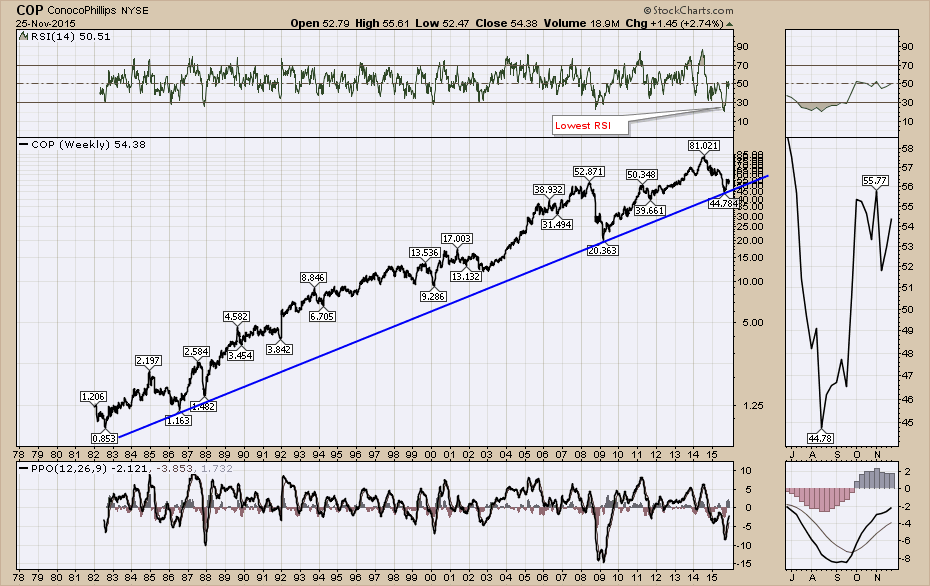
Maybe this chart is a one off, so let's go look at Conoco Phillips (COP). It has not broken the trend line.
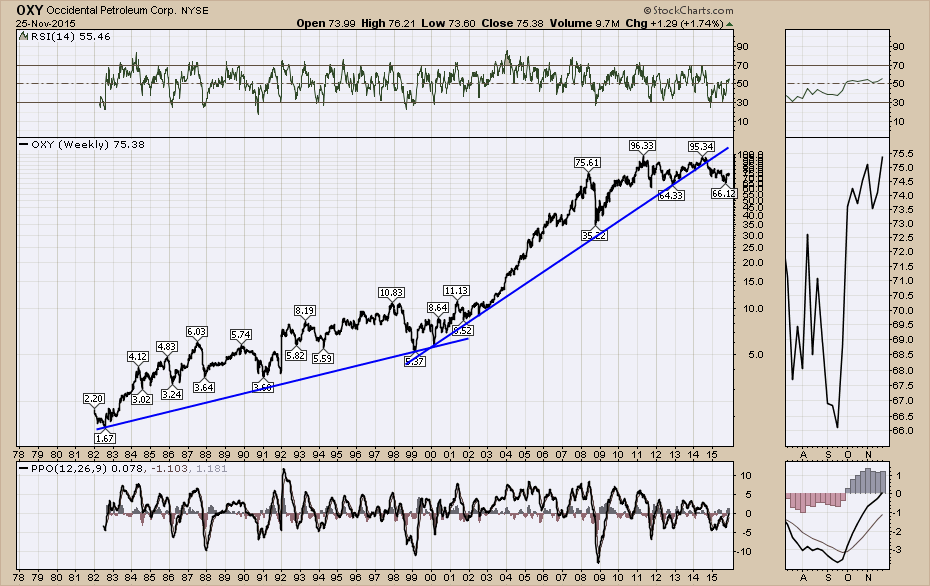
Here is Occidental Petroleums. OXY. This broke a 14-year trend line.
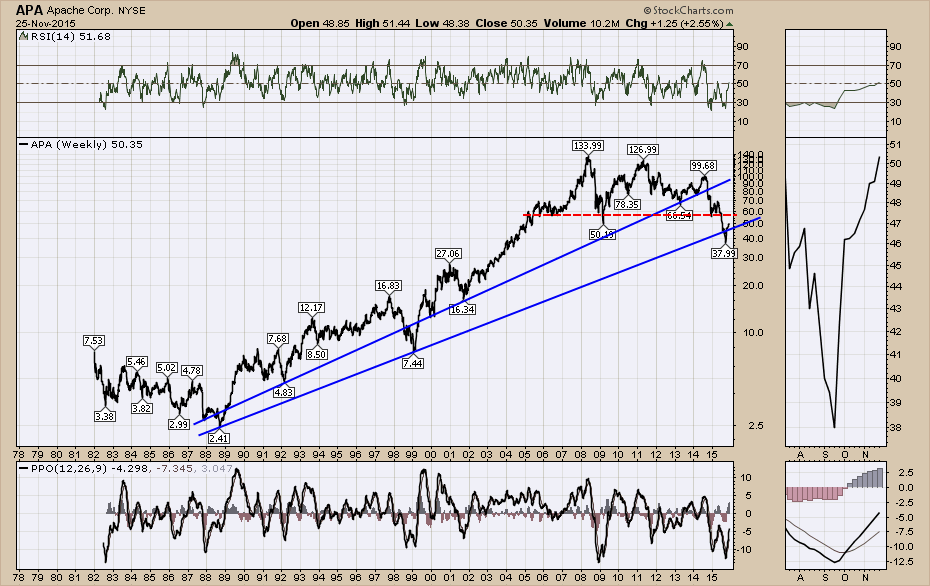
Here is Apache Resources. (APA). Apache broke a 15-year trend line and a 37-year trend line. It also looks like it broke down through horizontal support shown in red.
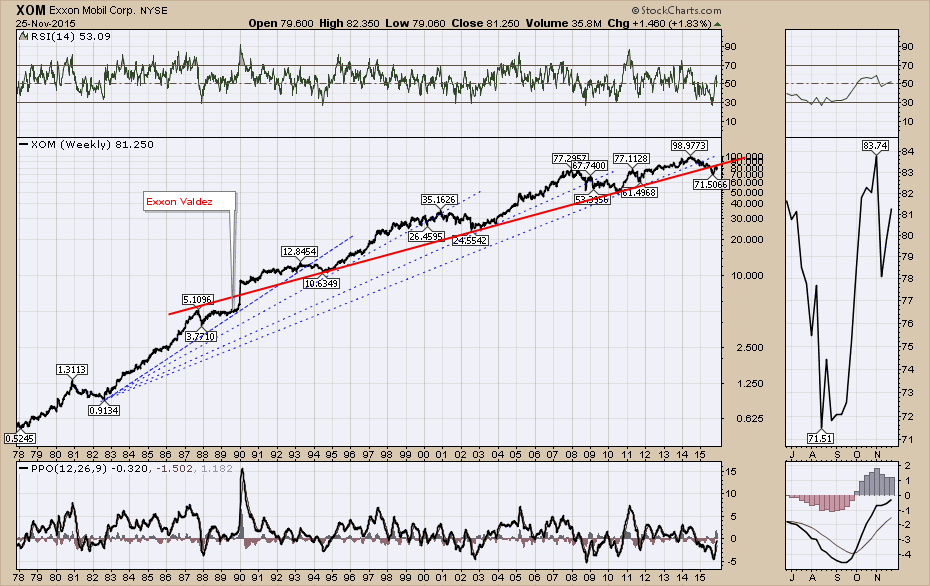
Checking in on the big 800-pound gorilla. (XOM). Well, the Exxon Valdez occurred below the red trend line. But this red trend line was broken for the first time since 1990. That's a snap on a 25-year trend on the world's largest publicly traded oil company.
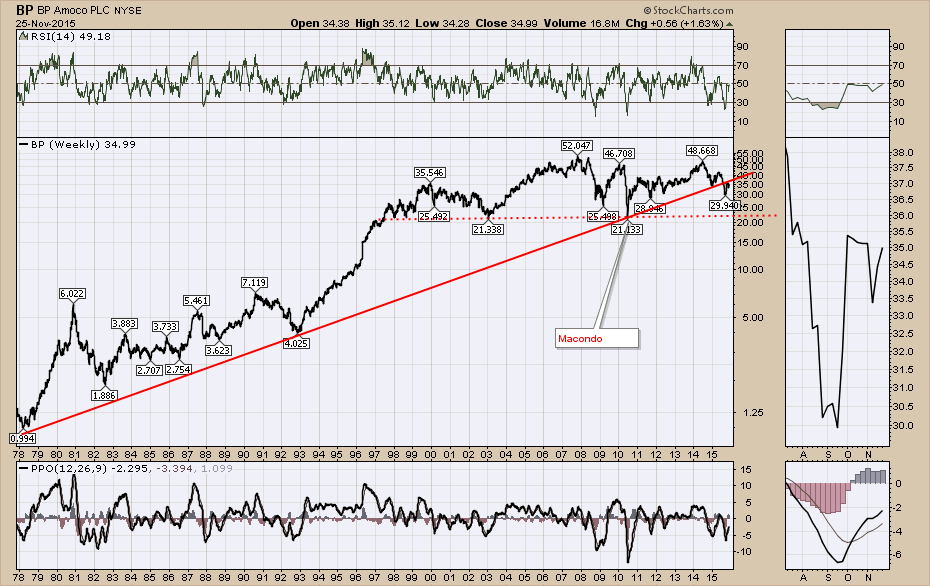
Here is British Petroleums. BP. This trend line was not broken by the Macondo oil spill from the Deepwater Horizon blowout in 2010. However, the recent break in crude and natural gas pricing has broken this chart as well.
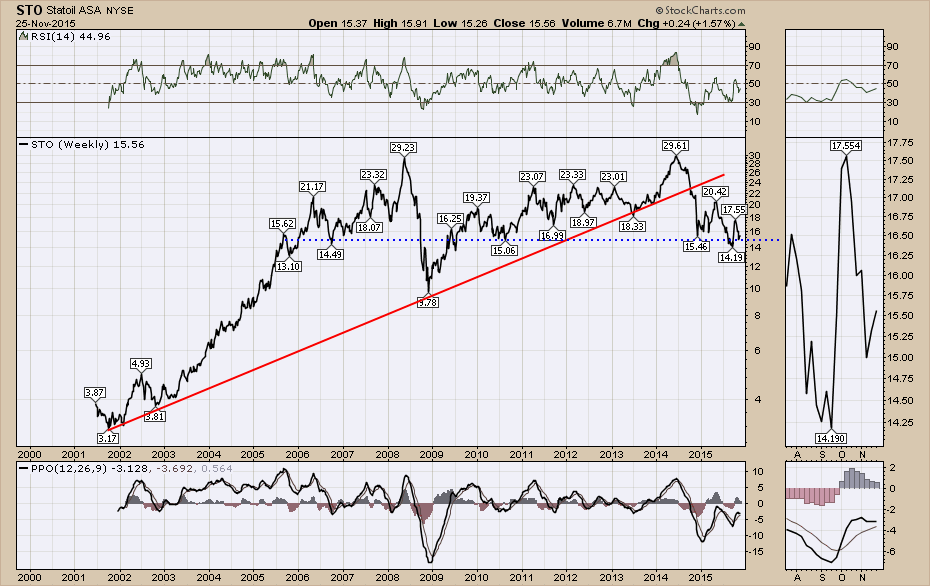
Going around the globe and looking at others, here is Statoil. (STO). This company has not been listed on the NYSE as long as the others. These trends are shorter, but the topping structure is also much more apparent.
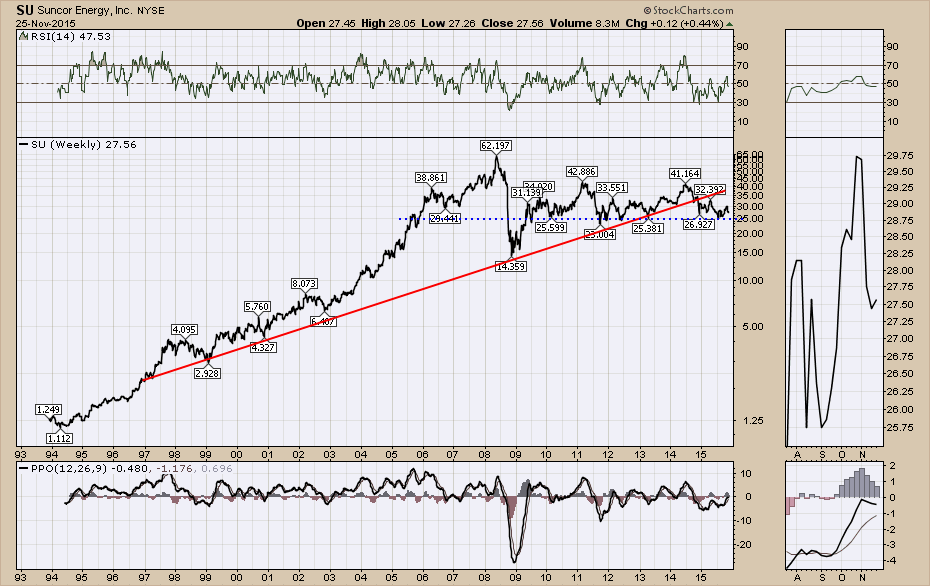
Here is Suncor. (SU) Can it stay above the blue line?
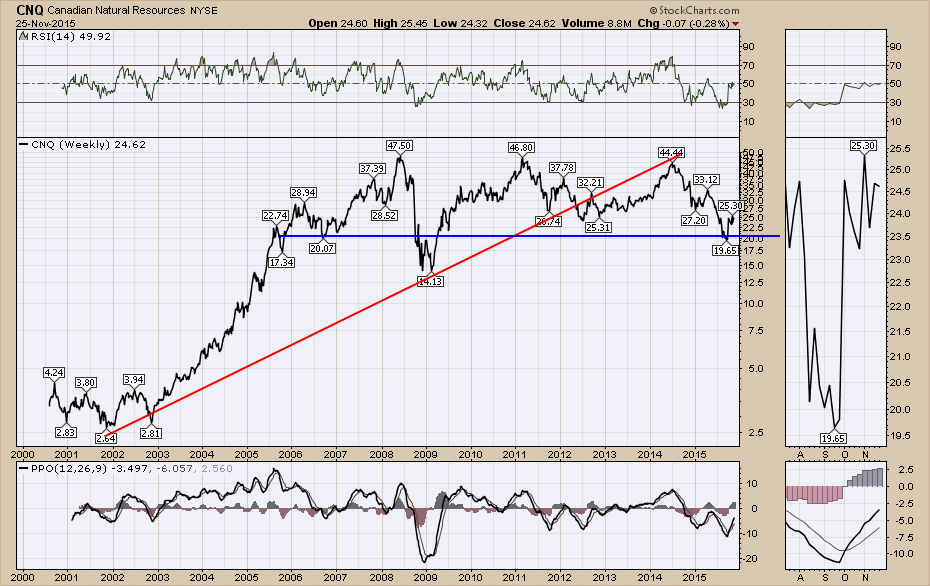
Here is Canadian Natural Resources. (CNQ).
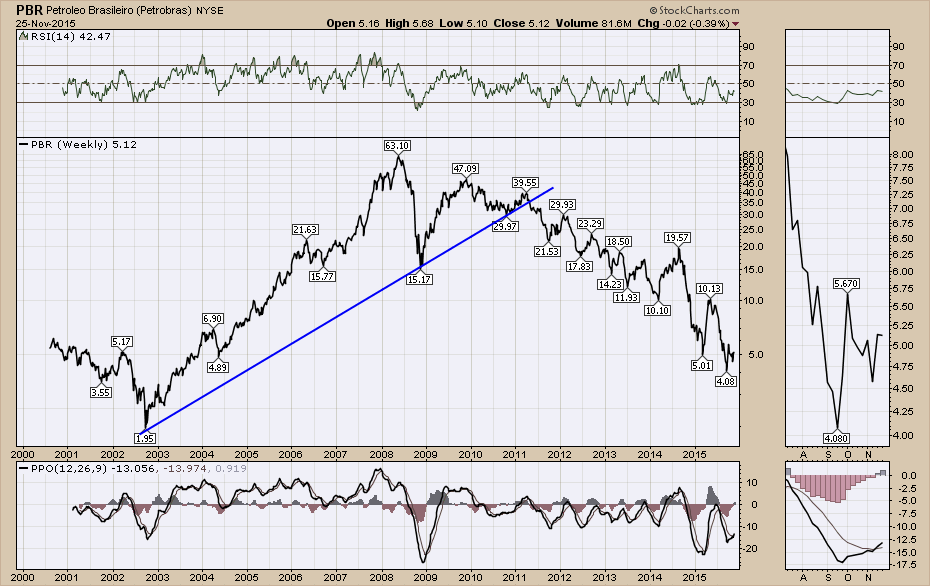
Companies like PetroBras (PBR) have been smacked down.
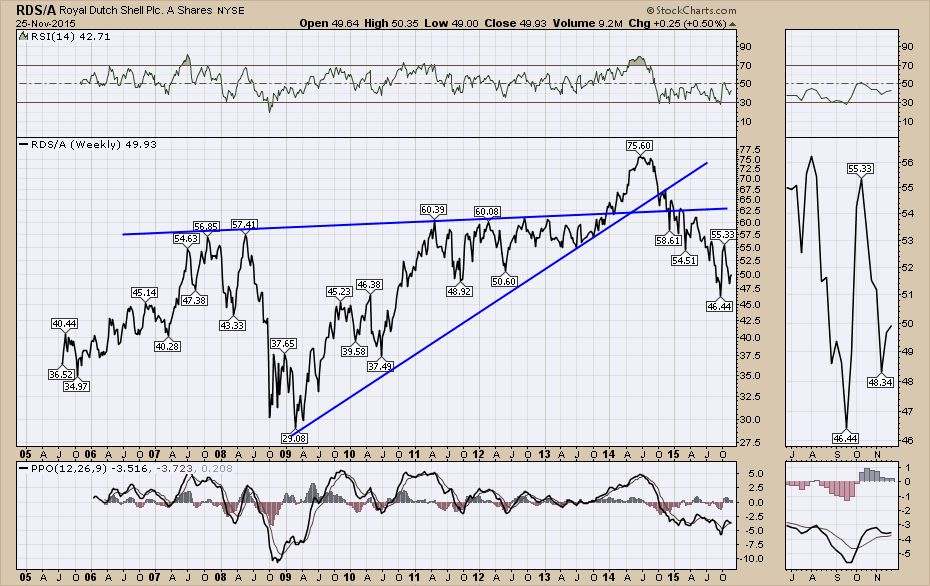
Royal Dutch Shell (RDS/A) changed their corporate structure so this chart only reflects back to early 2005. This would have been a great check if we had a longer trend available. I included it just so the obvious was not missed.
The bottom line for me is that the majority of companies have snapped long trend lines. Why would you use this as a discussion tool? Perhaps we can work through some long term examples of previous breaks in other big stocks.
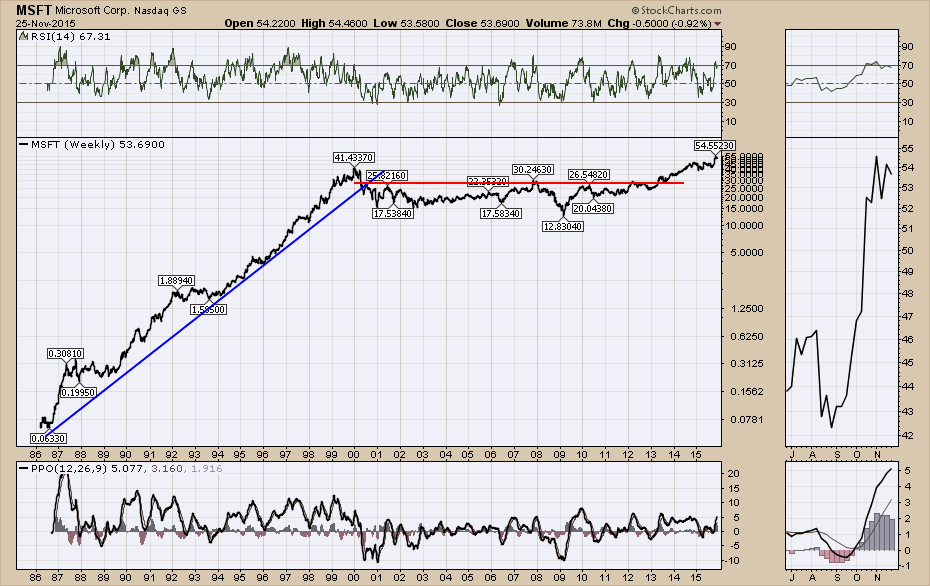
Here is MSFT in 2000 and more recently through 2015. Notice how important the breaks of the long-term trend lines were.
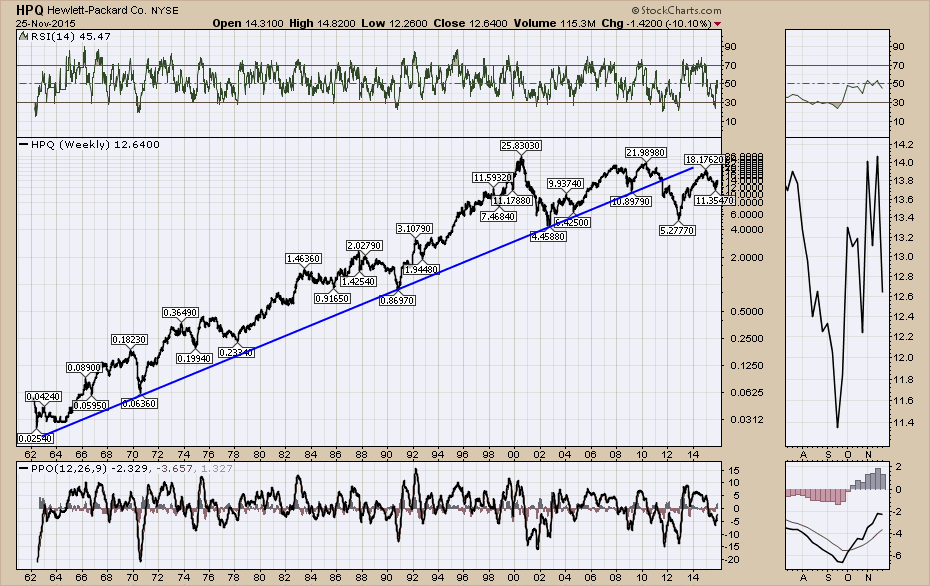
Below is Hewlett Packard- $HPQ which has been struggling for years.
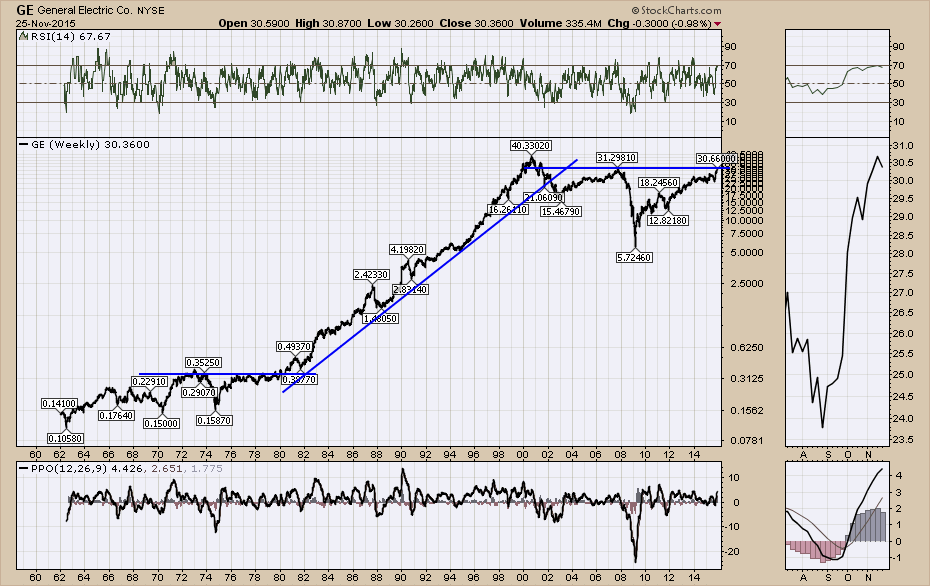
Here is General Electric - GE. When the long-term trend lines were broken, it was important to recognize the change in the trend.
So looking back at oil companies breaking below their long-term trend lines and the potential for some of the solar stocks to start breaking through their trend lines, suggests we could be witnessing a major trend change.
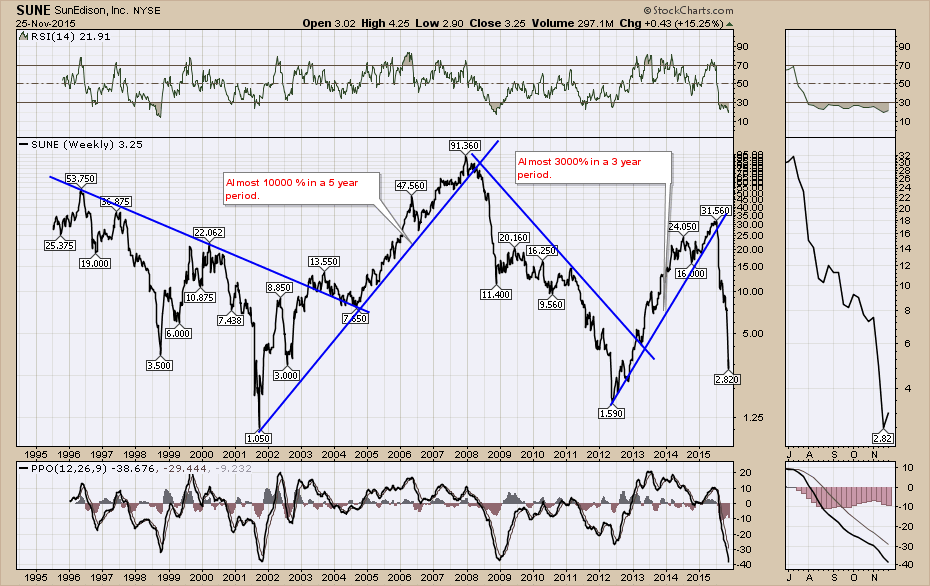
Recently, Sun Edison (SUNE) imploded to pull down the Solar ETF (TAN). Look how important 3,4 or 5-year trend lines were on Sun Edison.
When we compare the Solar ETF (TAN) to the Oil producers (XOP) we see the trend for solar has been outperforming oil for a few years but recently pulled back to this trend line.
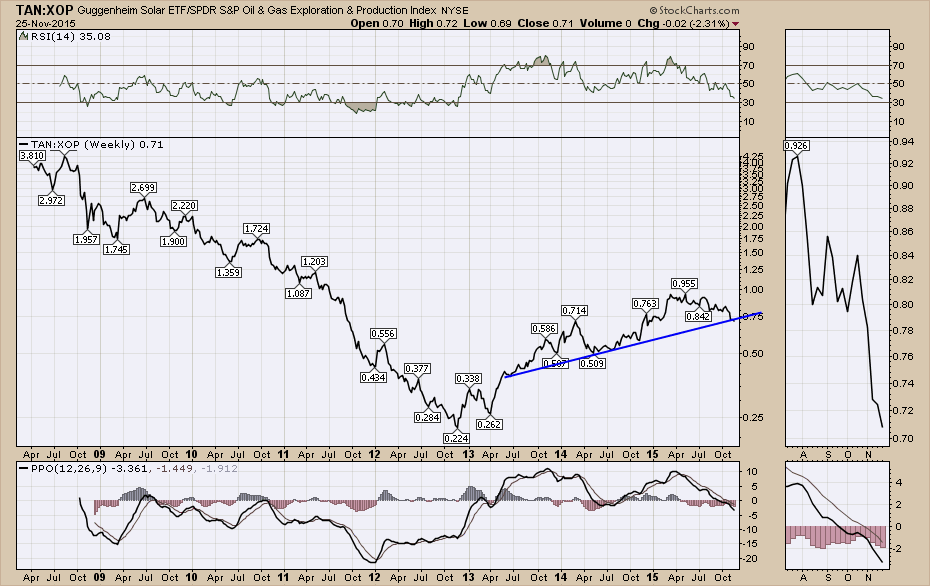
If solar stocks start to surge here and break through some of their long term resistance lines, this could be a timely entry. For those who have read my work over the last few years, we have discussed some great trading ideas into and out of solar stocks.
Here is FSLR again. If it can't break through this long-term resistance line, I think we should avoid it. But if it does break through, it could be one of the breakout trends going into 2016.
The Canadian Technician webinar of Tuesday, November 24th covered this off with some more description. You can find the webinar recording by clicking on this link. Canadian Technician 20151125.
To conclude, I don't think it is a coincidence that some of the Solar stocks are trying to breakout higher as oil is basing. However, it might be that the big money in oil has been made until we can see some long term trends restart. So if oil gets moving, believe it or not, it might make solar a better investment. It should be interesting to watch how prices react at these trend lines.
Good trading and Happy Thanksgiving,
Greg Schnell, CMT
