In a day where the 60-minute charts of the indexes were rattled, the commodities had another great day. In today's webinar, I demonstrated major changes in the energy and material stocks. You can watch the video here.
"Commodities Countdown LIVE!" with Greg Schnell - 2016-04-28 17:00 from StockCharts.com on Vimeo.
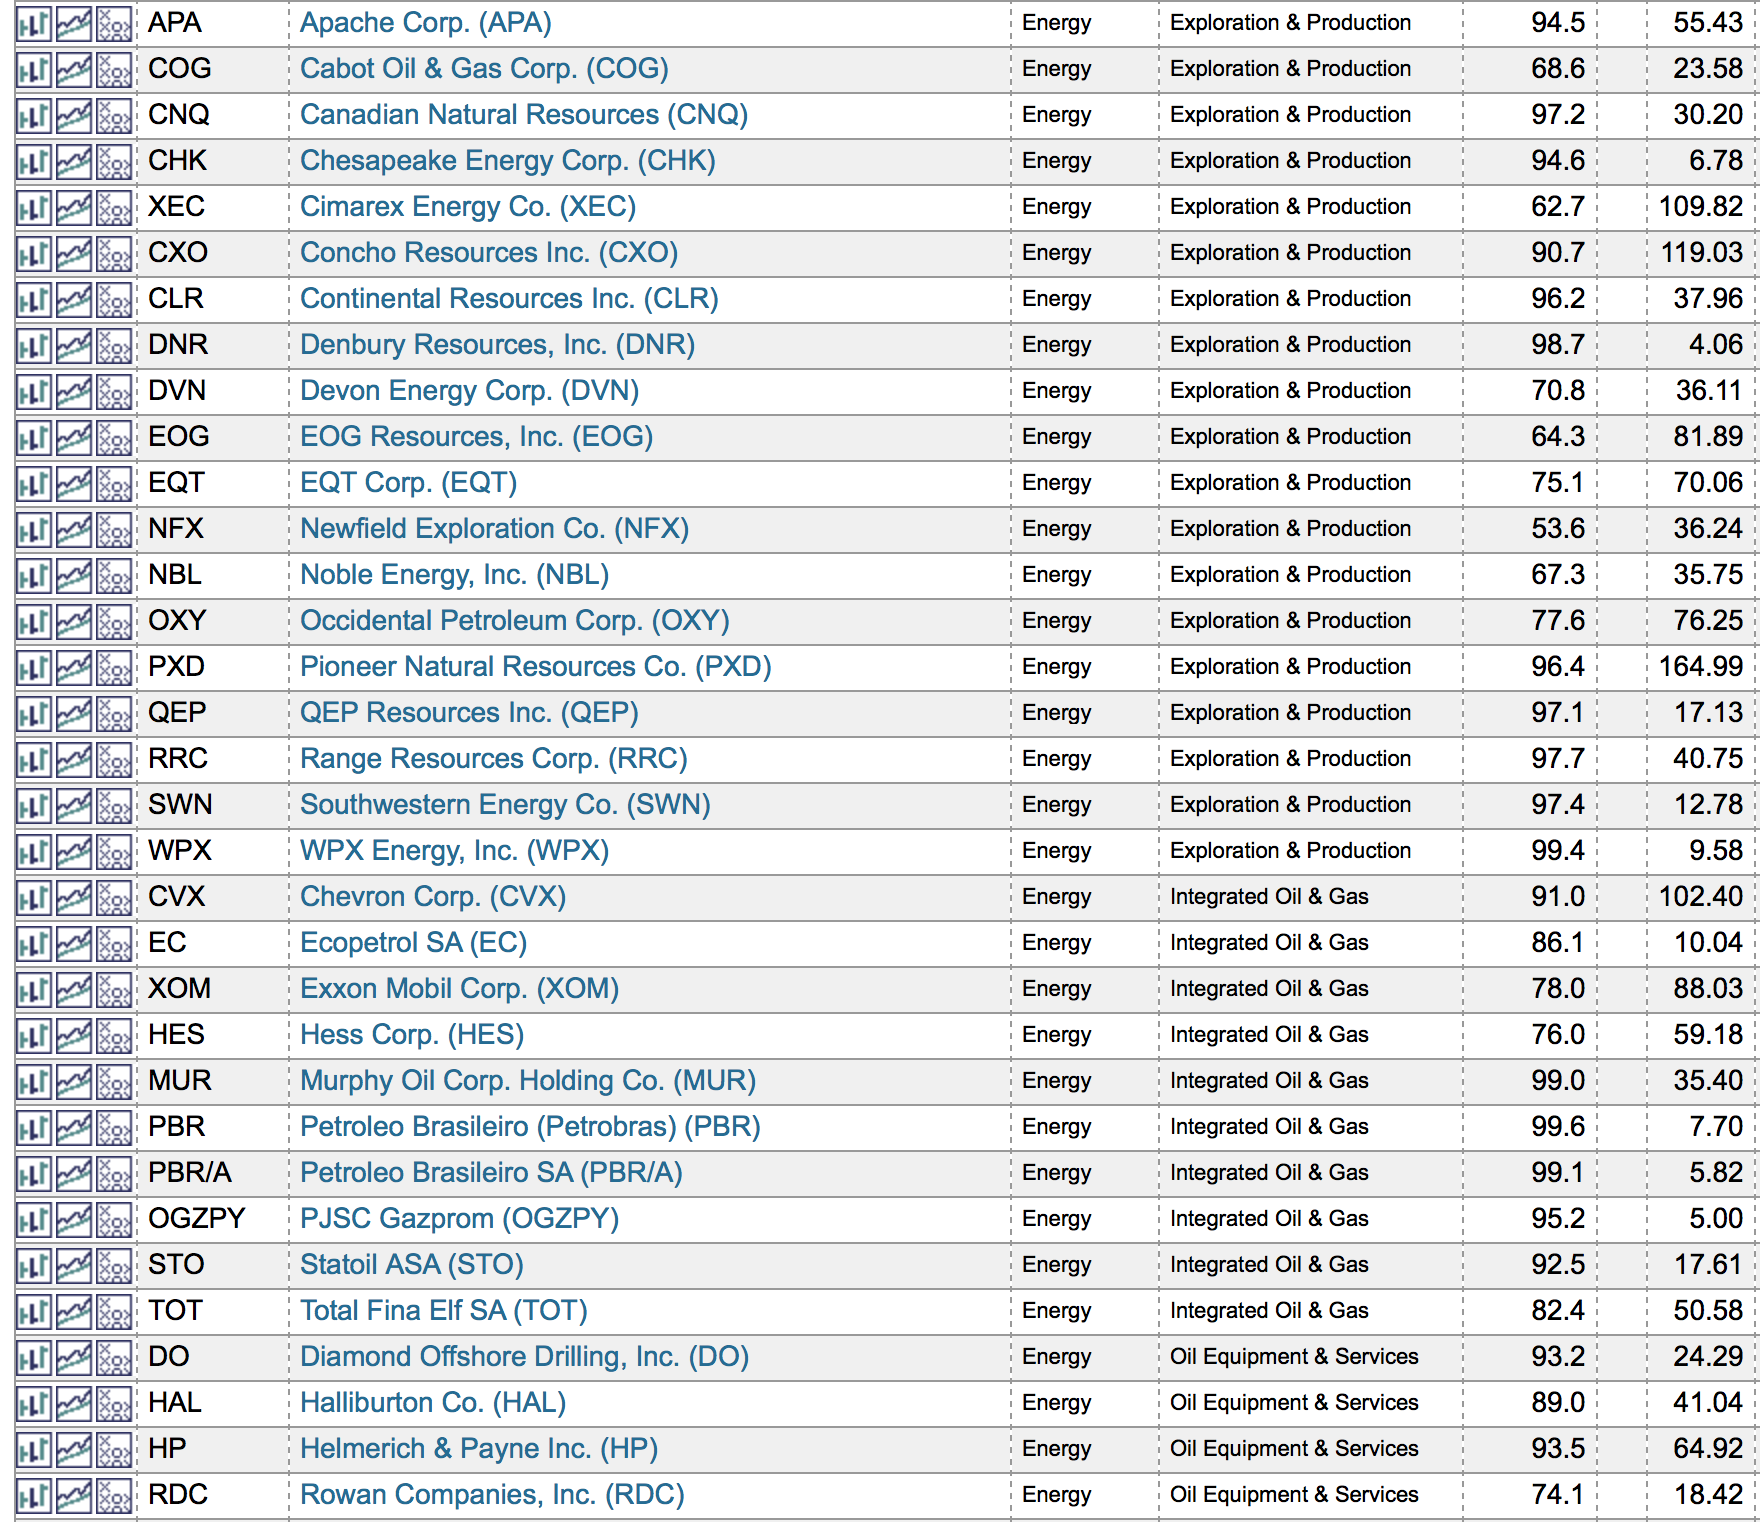
The level of investing participation suggests to me that the institutional investors are aggressively positioning in the oil and gas industry group. While only a few oil and gas stocks ranked in the top 25% in January of this year, the list is long and abundant now. With lots of strong stocks to choose from, there looks to be a significant amount of upside available even if crude just stays in this range. A double off the lows would equate to $52.10 for the price of crude oil. West Texas traded into the $46 level today and $BRENT traded over $48. This change in price is almost exactly 3 months from the low and 80% higher. On the webinar, at the 38:00-minute mark, I demonstrate the difference in the SCTR rankings and show the top performers are in the energy sector.
One of the things that I thought about after the webinar, was the fact that the small and mid cap SCTR leadership groups did not have a strong participation level in energy sector stocks. This could be because of the debt impairments and only the large cap energy companies are being bought by the institutions currently. That is my potential theory as to why the discrepancy appears between the SCTR groups. This is a list of the Large Cap energy stocks, but there is a lot more commentary around this on the webinar.
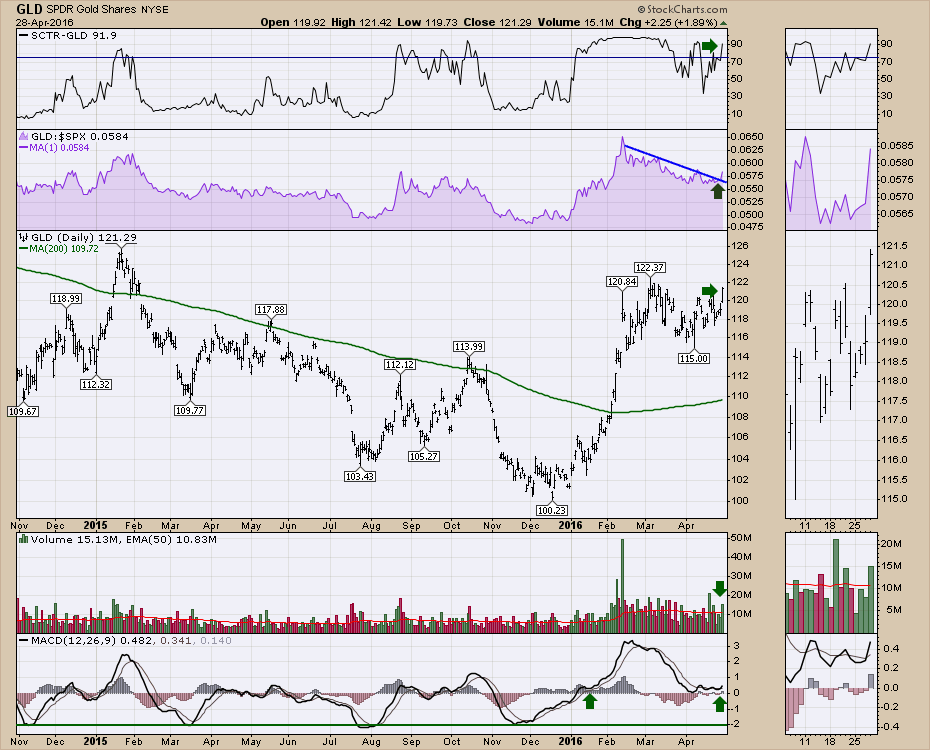
 Secondly, the gold sector continues to soar. The price of Gold pushed up and the GLD tracking ETF has an SCTR over 90. The Relative Strength broke the downtrend. GLD made a one-month high. The chart also shows above average volume on the push and the MACD is just turning up after resetting near the zero line. That is all very bullish.
 As part of the SCTR review in the webinar, you can catch the strong presence of precious metal stocks specifically in the Canadian index review, but the same can be said in the USA.
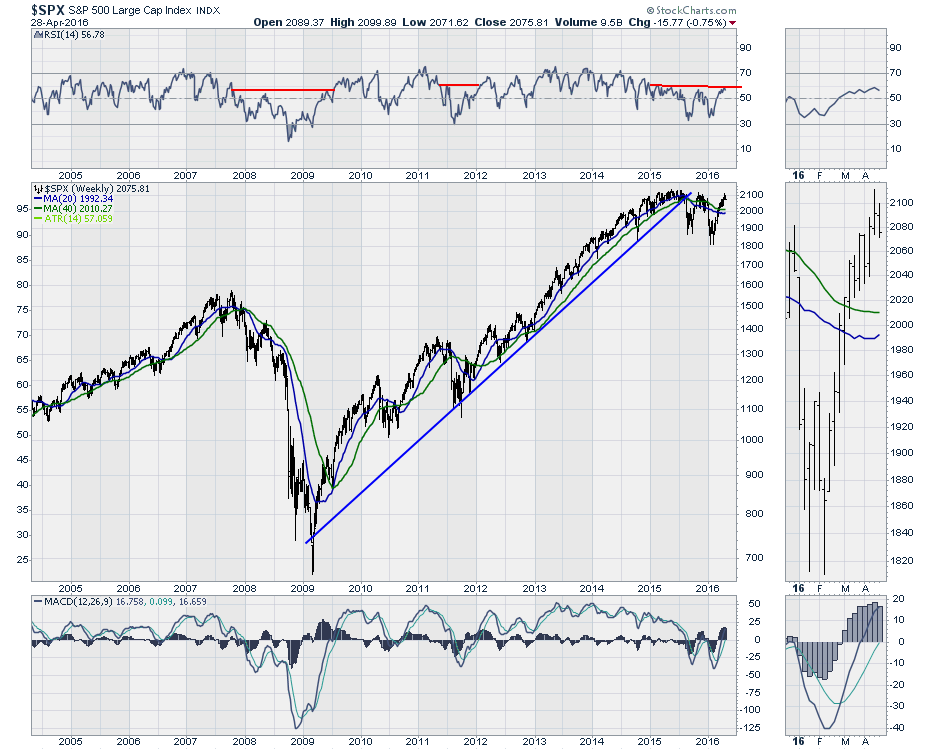
A few areas of concern were in the global macro picture. Now that we are close to April's month end, I took the opportunity to explain my concerns in the global markets as well as the $SPX and $NDX. They still have bear market signals on the RSI and this is the area where they would roll over from. The Nasdaq made new one-month lows today.
Here is an example from the $SPX. While the $SPX has rallied for the better part of 2.5 months, we can see the RSI is still in a position that occurs in bear markets. Until this RSI can firmly start a new bull market signal we have to be cautious. The current breadth is excellent. This chart suggests caution when paired with the rest of world. You can see this starting at the 19:30-minute mark of the webinar.
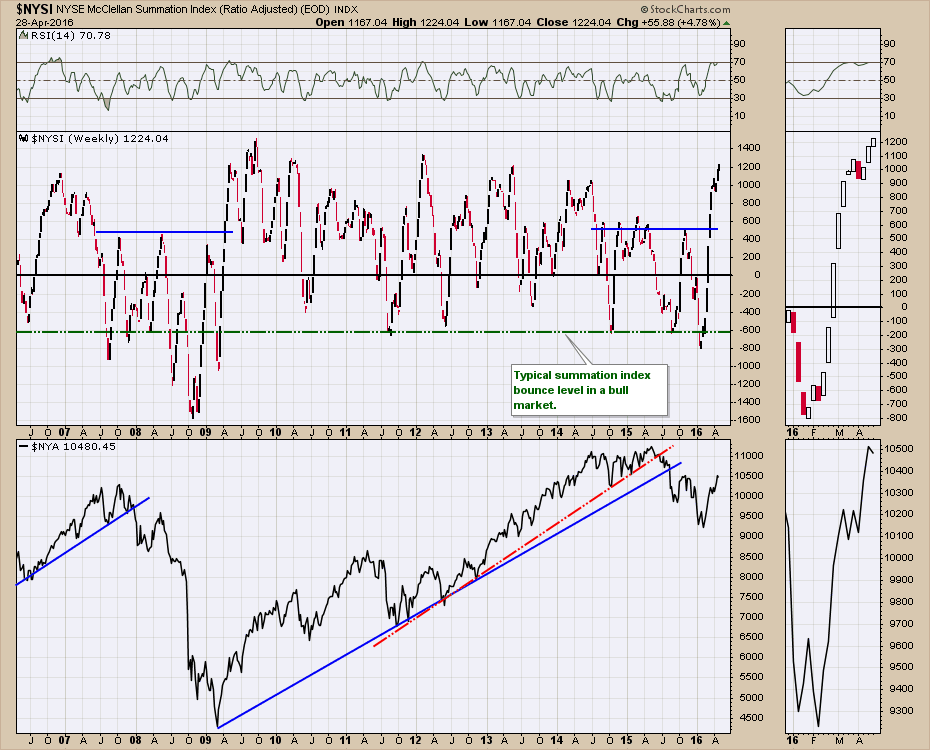
 I spent the first 10 minutes on the webinar explaining how the breadth is currently excellent. The main reason we keep track of breadth is it helps us understand if just a few of the stocks are participating. Once of the important points is when the beaten down stocks rally, they don't necessarily become the market leaders. In the current environment, the worst sectors at year-end have moved to a leadership position so all the major sectors are above the 200 DMA, and lots of stocks in each sector are participating. This sort of breadth where all sectors are participating does not usually mark a final market top. Usually, the market weakens with less participation each week and slowly the negative inertia takes over. While Apple and Microsoft might be weakening currently, there are lots of other companies stepping up.
 With major cap companies like Starbucks and Alphabet also struggling after the earnings, there seems to be some significant selling in those former leaders and a rotation into these new fast-moving sectors. Managers who are not well positioned in the strong sectors will find themselves trailing their index benchmarks. It is this rapid rotation into the new strength sectors that seems to be confusing. This is outlined in the SCTR review I mentioned earlier on the webinar.
I would encourage you to watch for trouble in the global environment as that might translate to weakness at home. We do have the Brexit. We also have some trouble brewing in Chinese banking, Italian banking, and other European banks. The Japanese market closed at an eery 16666 on Thursday.
You may wish to capture my twitter feed. Search Twitter for @Schnellinvestor. Click yes below to get registered for email updates of this blog. You can also click yes down below on the Canadian Technician blog if you would like to get that by email as well.
Sometimes it feels redundant to write about markets like gold that continue to climb higher. There are a number of positive trends setting up in Commodities. I would encourage you to read as many articles as you can to get some good ideas. Here is a link to the webinar if you would like to check it out. Commodities Countdown 2016-04-28. There are some great articles on the blogs by other authors. You might want to spend some time this weekend clicking through.
Good trading,
Greg Schnell, CMT, MFTA.
