In a dramatic 48 hours leading to May 5th, a forest fire in Alberta went from reasonably small to evacuating 80,000 people, and a fireball-approach-damage-estimate at $3 Billion. The story is unbelievable in its rate of change. After having so many people laid off in the oil patch, this Canadian city of Fort McMurray lost more soul today with 1600 structures destroyed including some entire neighborhoods. As part of the Commodities Countdown Webinar 2016-05-05, I explained the size and scale of the devastation.
"Commodities Countdown LIVE!" with Greg Schnell - 2016-05-05 17:00 from StockCharts.com on Vimeo.
Webinar Highlights // Commodity Charts 0:00 // Lithium 22:00 // Oil Supply,Demand 25:00 // Oilsands and the fire zone 28:00 // Oil Service - Pipeline Stocks 34:00 // Breadth 43:00 // Indexes 50:00 //
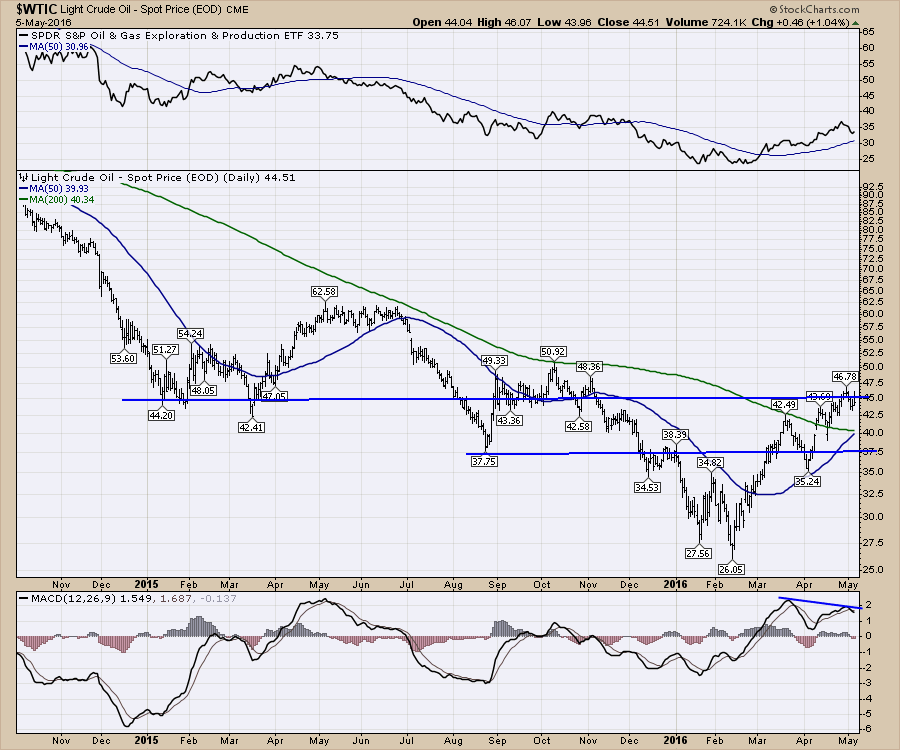
Some of the important charts from the webinar are listed below. The chart of crude oil stopped at resistance around $45.00. There is a nice area of support around $37.50.
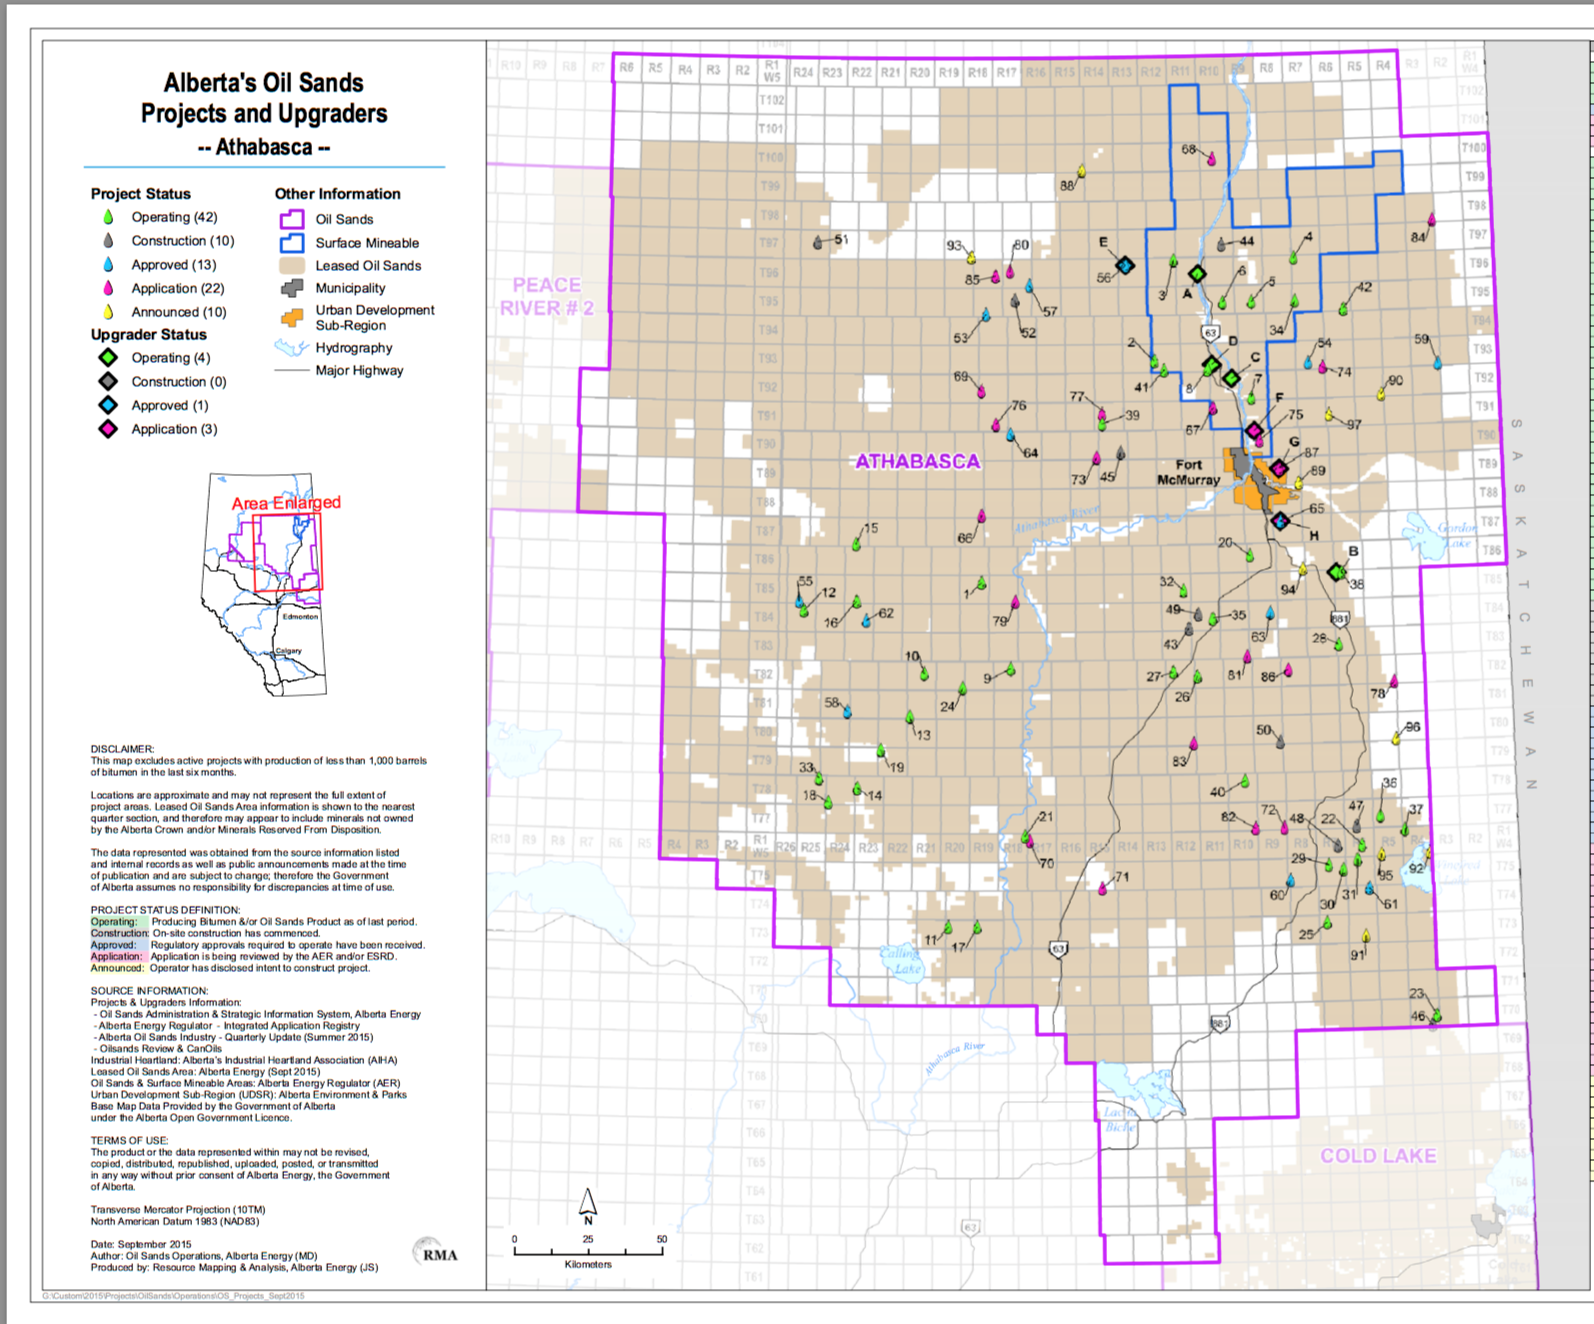
 With the fire in the Oilsands region of Canada, I spent a little time on explaining the size of the reservoir shaded tan on the map below. The scale on the map below is 50 Kilometers = 30 Miles. So every little box is about 7.5 miles. The fire is now moving southeast of Fort McMurray. Mid-afternoon, the fire had expanded to 210,000 acres or the size of a city of a 1,000,000 people.
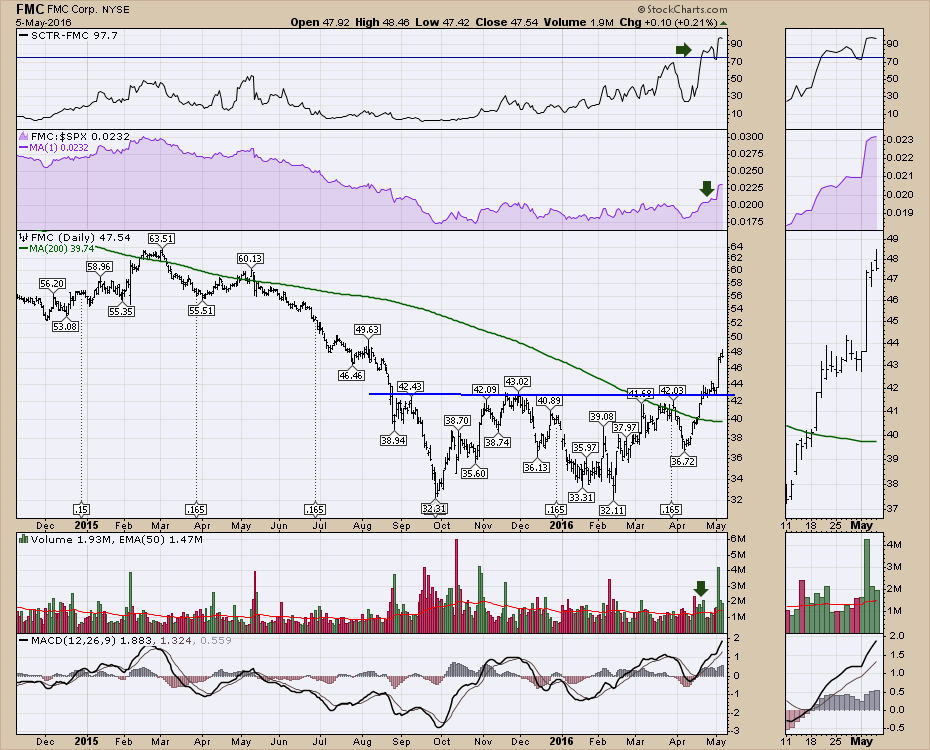
One of the interesting charts is in the Lithium space. FMC Corp (FMC) had a nice week.
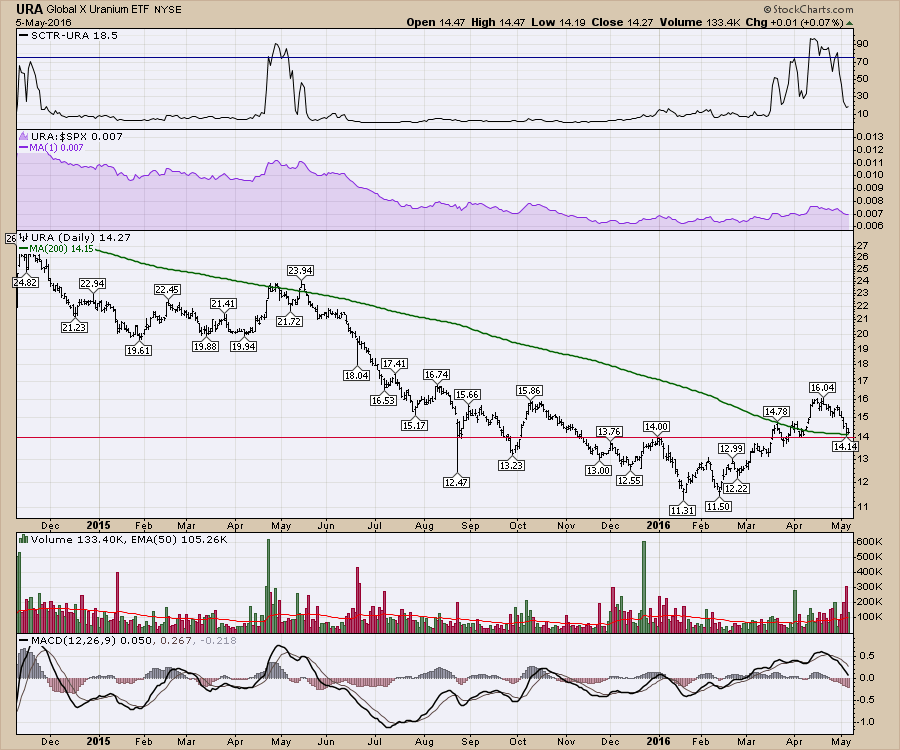
 The Uranium supply area has a very interesting chart this week. The ETF (URA) has some classic technical traits this week that move it to the top of the radar. I like to see the SCTR rally above the 75 line and then pull back. If the SCTR starts to rally back above the 75 line, this would be a very bullish signal on the chart.
The second signature is the price is currently back-testing the support/resistance line. This level of $14.00 is also where the 200 DMA resides currently. This coincidence of support is very timely after the ETF has spent the last year below the 200 DMA.
Lastly, the MACD is approaching the zero line. If it could bounce off the zero level, this would be a very typical place to bounce from to start a new bull run. So while the setup is currently lining up, we'll need to watch closely to see if this starts the next leg higher. All eyes on deck!
 There is a lot of information on this webinar. I would encourage you to take the time to review the recording. Click here to open the link to the Commodities Countdown Webinar 2016-05-05. If you would like to receive this blog in your email when there is new content, please hit the Yes button below. You may also wish to subscribe to The Canadian Technician blog. There is also lots of content there.
Good trading,
Greg Schnell, CMT, MFTA.
