Well, that was fast! Oil makes strides towards $50 so the bear market in oil from 12 days ago is officially over. A business news channel announced a new bull market in oil because it is up 20% off the lows. Best to ignore hype reporting that leads us into and out of trades. This same news network had everyone bearish 2 days before oil bottomed by talking about the new bear market in oil starting August 1. Maybe we'll just use the $WTIC charts and look for support and resistance levels!
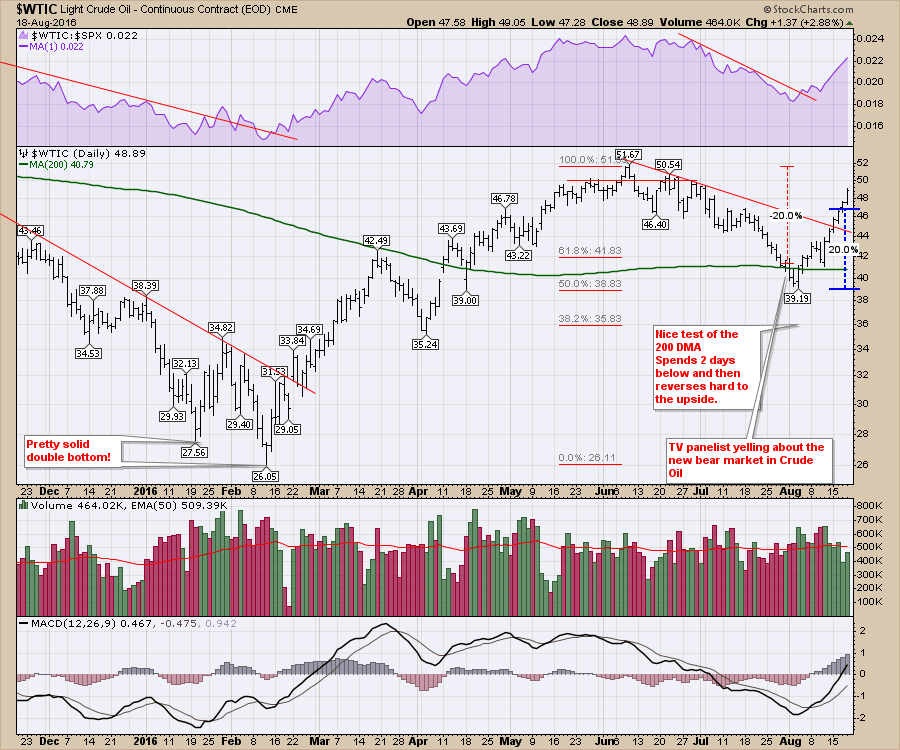
We have been covering Oil's pull back and we wanted to watch for how it handles the test of the 200 DMA. Sure enough, that was a nice place to expect a bounce and we got one. Now we have to watch how it handles overhead resistance around $50.
I also wrote a blog on Thursday about all the technical information on the crude oil chart. You can find that article here. Will Crude Oil Break Out to New 2016 Highs? I expect crude to move higher through the fall and into the spring. If the resistance at $51 is broken, a measurement of the basing pattern would suggest oil at $75. It doesn't really matter what I expect, but my trading bias is higher. The good news is we get information every day to help update expectations! The key is getting out if your bias is wrong.
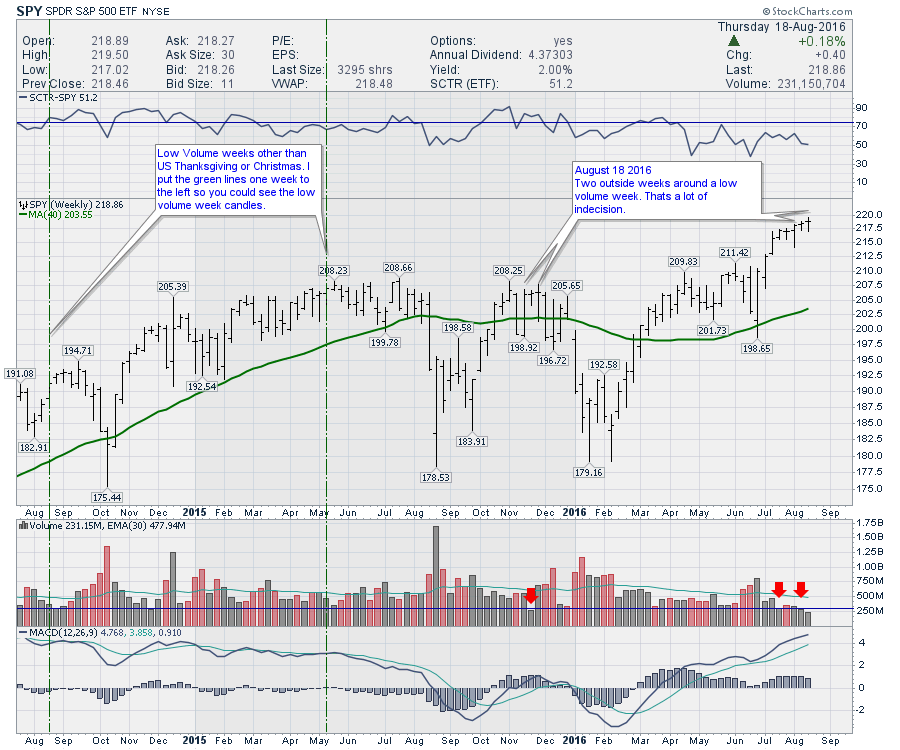
My guiding theme is outright bullish, but the weakness in the SPY chart suggests a little caution for index traders. We have had 2 of the last 3 weeks extend lower and higher than the previous week. We call that an "outside week". The implication is that the market is testing lower and higher so a little indecision. Placed neatly between our outside bars is an extremely low volume week from last week. I showed another example of this condition in 2015, but the volume was Thanksgiving week. Last week we had a 5 day trading week with very low volumes. None of these are compellingly bearish, but they are cumulative signs of a weakening uptrend. Perhaps all of our Hamptons traders will come back from the shoreside and start trading to rejuvenate the market here.
 I mentioned that index traders should be cautious, but there are some beautiful pockets of enthusiasm setting up for those who are looking. The energy trade is looking great with Natural Gas, Coal, Oil and Wind Energy all rallying. As a broad measure, look at the XLE. That is a nice move above resistance. All the talk is about OPEC and their next meeting. Try and spot where the meeting was on the chart and scroll below for the answer.
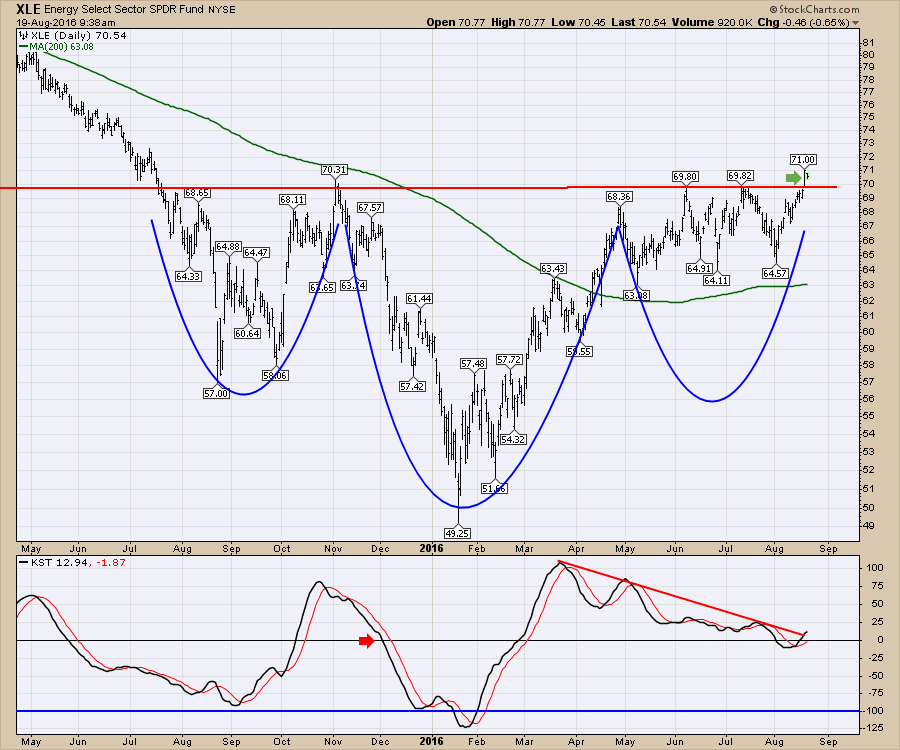
The funny part is after the last meeting in Doha, they never agreed to anything and the oil market kept rallying. Just for reference, that meeting was April 17th. We might not have powered much higher on the XLE, but don't forget oil went through a Bear Market and a Bull Market since then! The XLE chart shows the KST sitting near zero. It has broken the trendline and we are looking for higher from here.
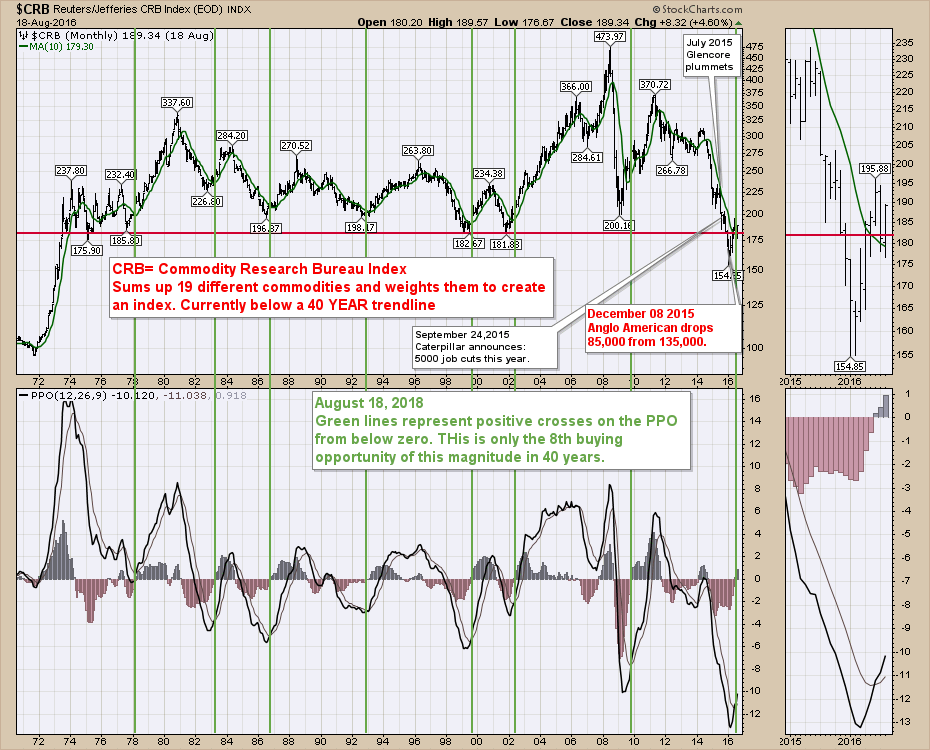
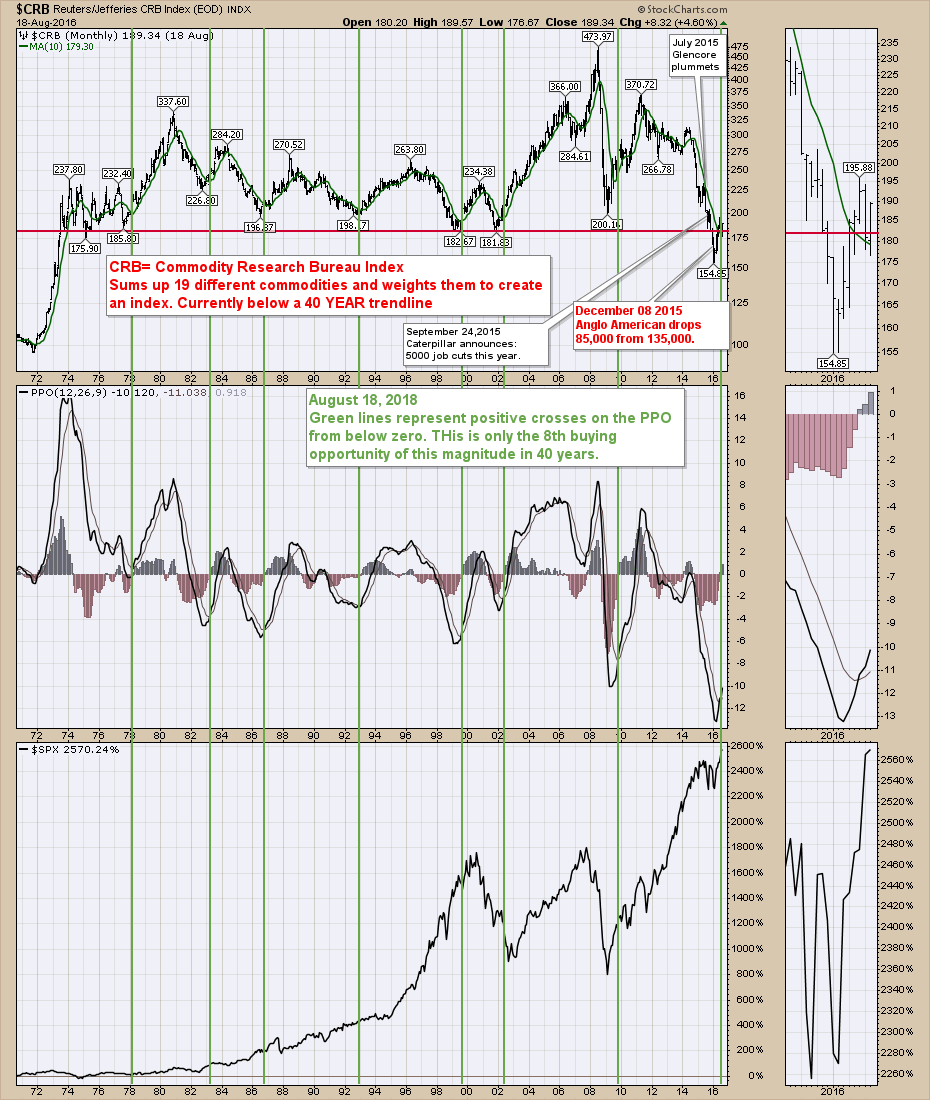
One chart that makes me a lot more bullish this week is the $CRB. When it is below the $182 level, this is a line in the sand for me. Staying below $182 suggests a major change in the 50-year trend. It is only one measurement, but seeing commodities stay below the line would reinforce the concept of a new deflationary period. Coming back up above $182 suggests that was a warning shot across the bow of economic policy makers. A rally from below, moving back above and staying above is bullish. The 7 major lows on the $CRB chart have all been unbelievably good buying opportunities for commodity related trades. As John Templeton says " The most dangerous words in investing are "This time it's different'. The bounces off very low levels should be a good clue for major economic rallies.
 I've added the $SPX on the chart below.
 I covered off a lot on the webinar. I would strongly recommend watching it. I outline some bullish trading ideas.
Commodities Countdown LIVE! with Greg Schnell-2016-08-18 from StockCharts.com on Vimeo.
But wait, there's more! Martin Pring and I will record a live webinar from Martin's office at Pring Studios on Tuesday, August 23rd @ 5 EDT !!!!! Martin Pring and Greg Schnell 2016-08-23 Back From The Precipice Webinar! Every now and then, the charts line up for a major decision. Currently, we have one of those moments in history. From Commodities, Equities, Bonds, and Currencies, there appears to be a global theme setting up. You need to click on the link to register! Yes, don't forget to click! Martin Pring and Greg Schnell 2016-08-23 Back From The Precipice Webinar!
But wait, there's even more! We have a new link to some of my favorite charts. It is a location you can bookmark to just browse the charts I think are currently important. You may disagree, but that's ok! Commodities Countdown Chartlist. Currently, I have some Bullish Percent Index (BPI) Charts posted with other commodity charts. Someone commented it was nice to see me back away from the edge after I was so bearish last summer when they were plummeting! The bottom line is they are still extremely strong and bear markets don't usually start with big, high, broad Bullish Percent Index readings.
I hope you agree that watching my webinars live is always so much fun. Yeah, whatever! Sometimes your calendar does not fit with mine. When it doesn't fit, you can check the webinar archives found here to see if you missed any. StockCharts Webinar archives. You can also follow me on twitter @Schnellinvestor and LinkedIn. If you would like to receive the rest of this series in your email, please click on the subscribe button below. It's guaranteed to give you a perspective for the markets you can't find elsewhere!
Good trading,
Greg Schnell, CMT, MFTA.
