This is a continuation of the article: "The Bank Review Three Months After Brexit" Click on the link to read it first.
In hindsight, Brexit injected fear into the market and the market has rallied hard for three months. Let's zoom in on some of the banks close to the issue.
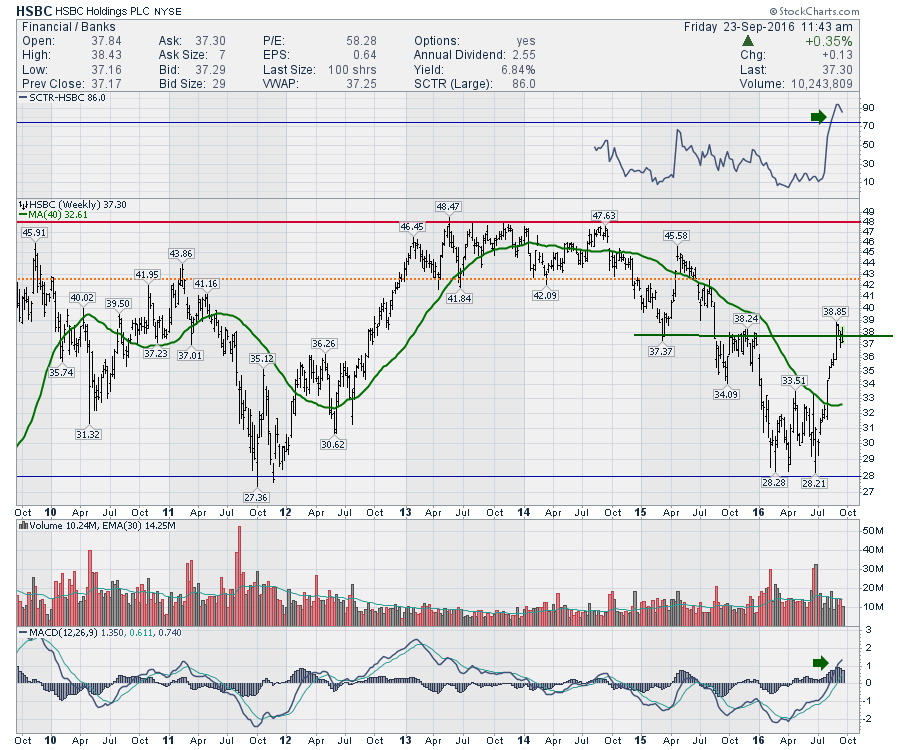
HSBC is one of the world's largest banks residing in the UK. With an SCTR ranking of 86.7, it is in the top quartile for large-cap price performance now. We can see the highs of $49 and $48 in 2013 and 2014 have created a ceiling for the stock but this level is a long way away from the current price. HSBC really jumped off the 4-year lows. As the stock is at a major resistance level, this is an important test for the stock. So far the stock broke out to a new high above $38.24 but then failed to hold it. That is not a positive.
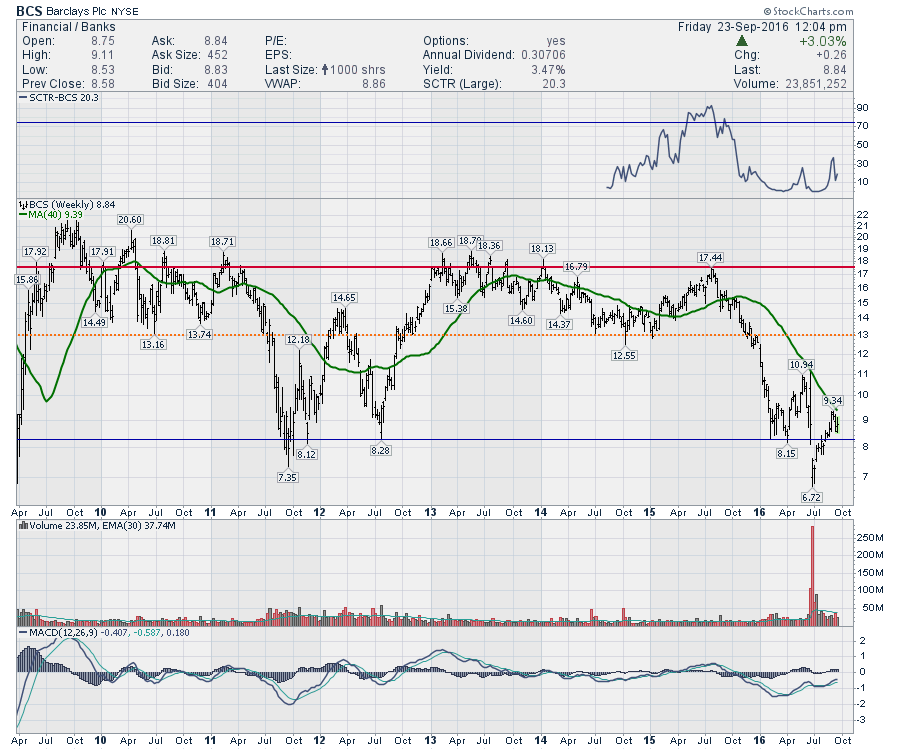
Barclay's PLC (BCS) broke to 6-year lows with Brexit. Since then, it rallied along with the rest of the market. However, the stock is still trapped below the 40 WMA and there is a lot of wide-ranging, volatile weekly bars around the $9.00 level. The SCTR is 20.3 so this mega-cap is still one of the poorer performers in the large-cap space. The volume has a space-needle appearance through Brexit as it went ballistic and almost doubled anything seen since the financial crisis. The momentum is still well below zero on the MACD. For me, this really needs to stay above the $8.25 blue level.
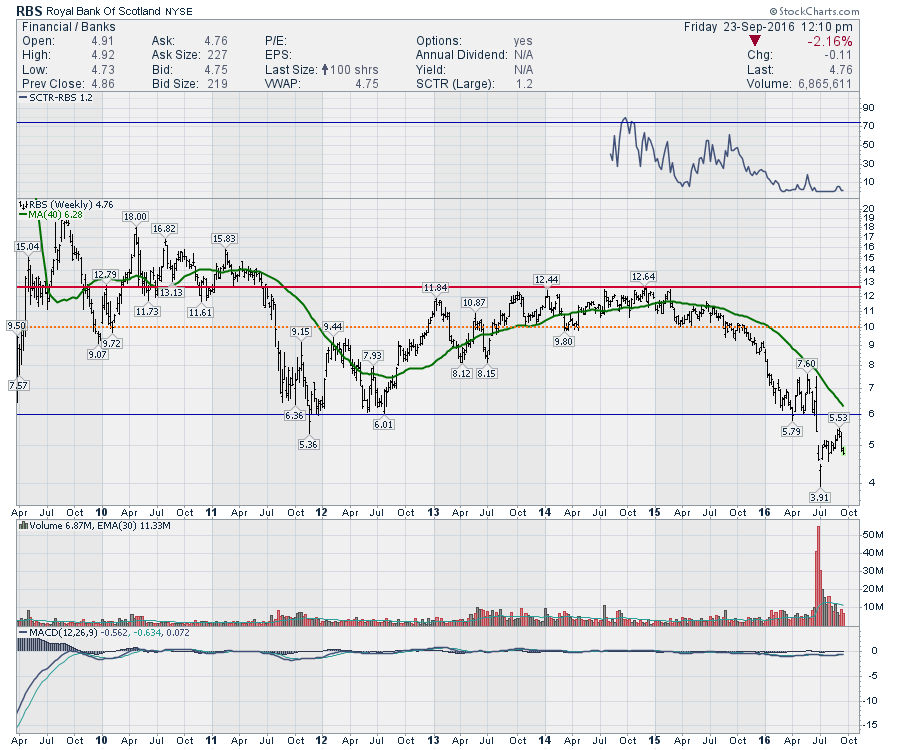
 Royal Bank of Scotland (RBS) is another large UK bank. The chart can best be described as abysmal at the Brexit low. However, this stock continues to look very weak. With the SCTR at 1.2, RBS has some of the worst price performance in the entire large-cap arena. Keep in mind, this is not just banks we are using for the SCTR calculation. This compares to the entire large-cap space with all nine sectors. RBS made highs back in 2014 and lost support in August 2015 when the US banking stocks were topping out. At this point, the stock is technically in free fall below $6. On this bounce, it was unable to hold above the $5.36 low. Gulp. This is an important time for the British-based banks. The MACD looks flat because of the size of the 2008 crash, but it is rolling over. You can click on these charts and shorten the period to a few years to get a better look.
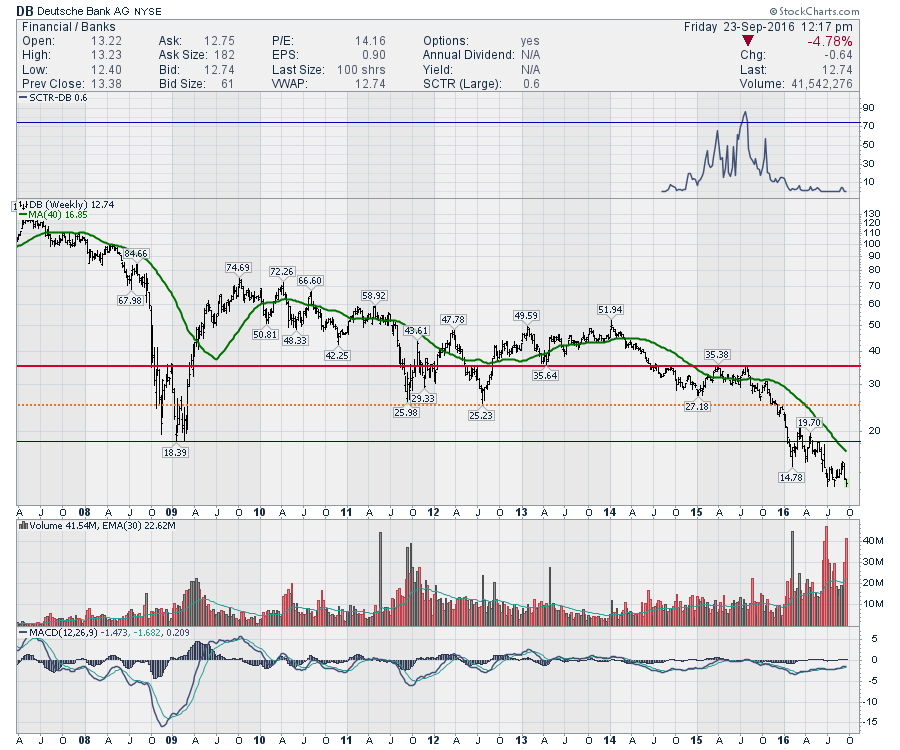
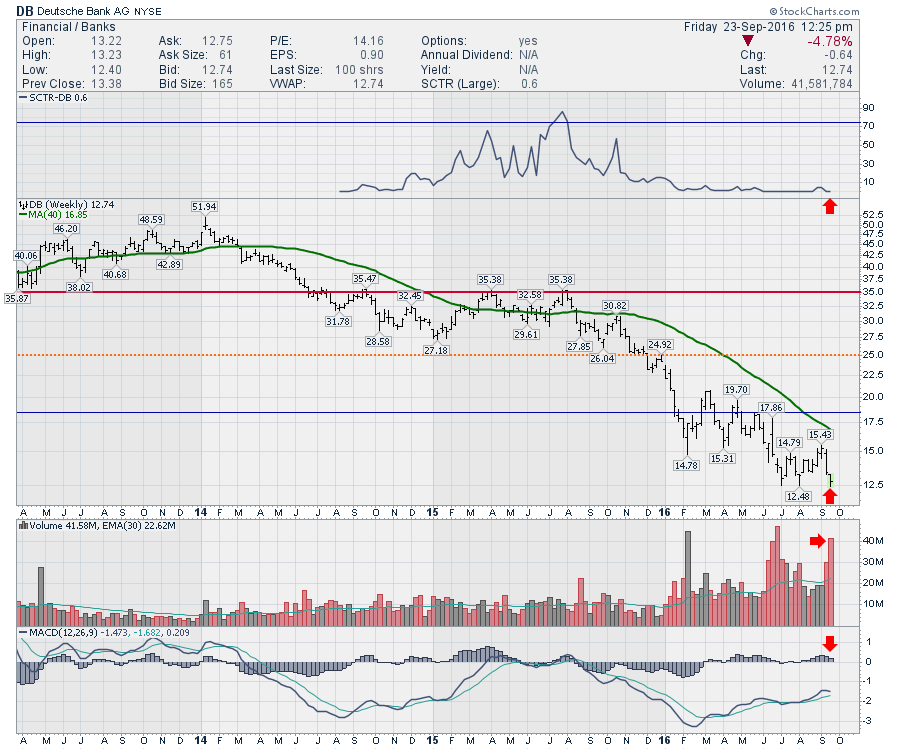
 Germany's largest bank, Deutsche Bank AG (DB) is not looking great. The SCTR ranking is 0.6, putting it in the worst 1% of the large caps. The cliff drop in 2007-2009 looks proportional to the rest of the chart, so I left it in. Earlier this year, Deutsche Bank AG took out the 2009 lows and Brexit Friday marked the lowest weekly close on the chart. Now we have tested the Brexit low twice and this week we made a marginally lower low. Yes, new 20 year lows on the US ticker symbol for this German bank. Notice the volume going ballistic on multiple weeks including this week.
 The chart below is still for Deutsche Bank AG (DB) but I have zoomed in on the last 3 years. A very negative MACD has not given a fresh new sell signal by crossing the signal line, but does it matter? This chart is top left to bottom right. Not exactly the definition of an uptrend. This continued pressure on the Brexit low is very concerning. The volume candle is huge this week and highlights the vulnerability of this chart.
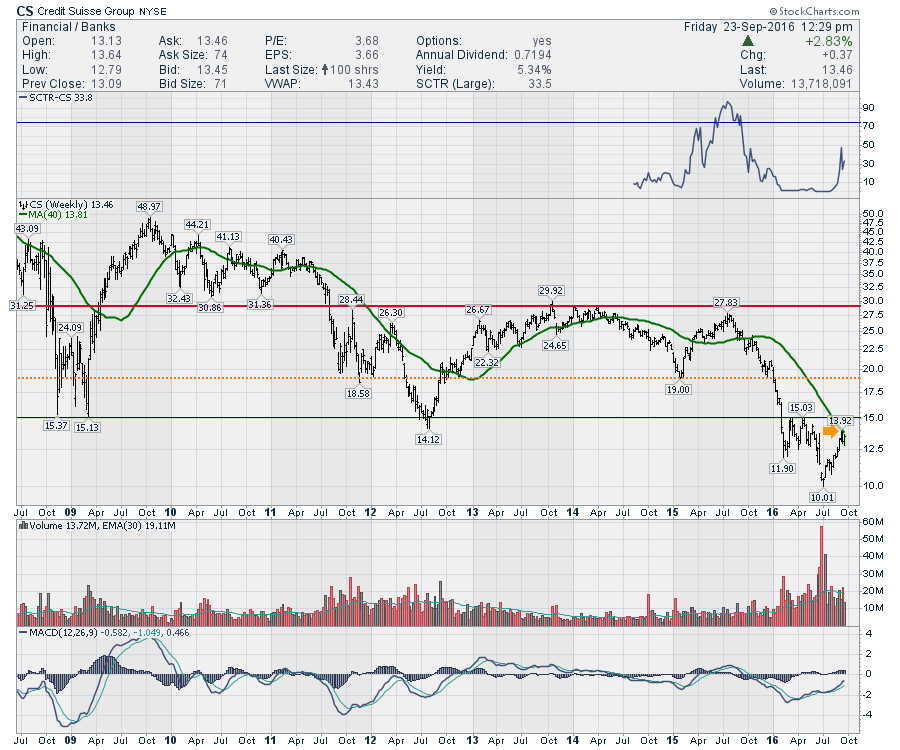
 From Switzerland, we have Credit Suisse (CS). This makes the Matterhorn look like no big deal. The SCTR has improved to 33 from a level of 1 on the Brexit low. The momentum was very negative but now it has set up positive divergence. However, the stock is hitting resistance at the 40 WMA and there is a major resistance level at $15. This is where we would expect a rally to fail. The stock is around 50% of last years final high.
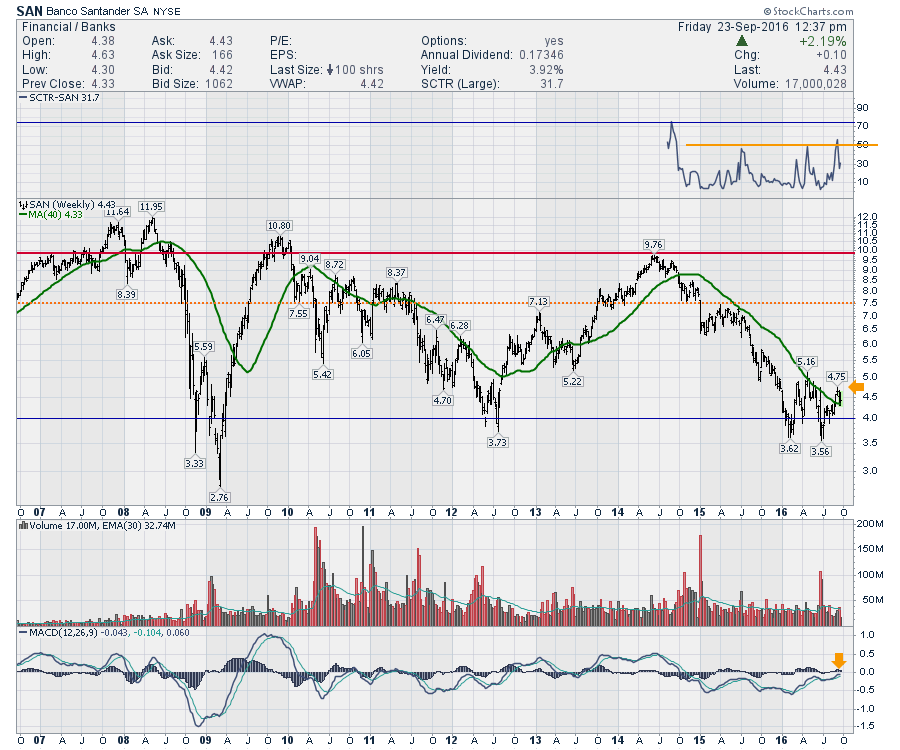
 Looking closer to Club Med is a Spanish Bank, Santander (SAN). The SCTR of 31 is well of the Brexit low of 3 but this still suggests a weak stock. The Brexit price was a fresh 7 year low. While some rally is expected in concert with the thrust across the markets, this stock is still making lower highs and lower lows. The MACD is already below zero for momentum. We'll see if it can get into positive territory.
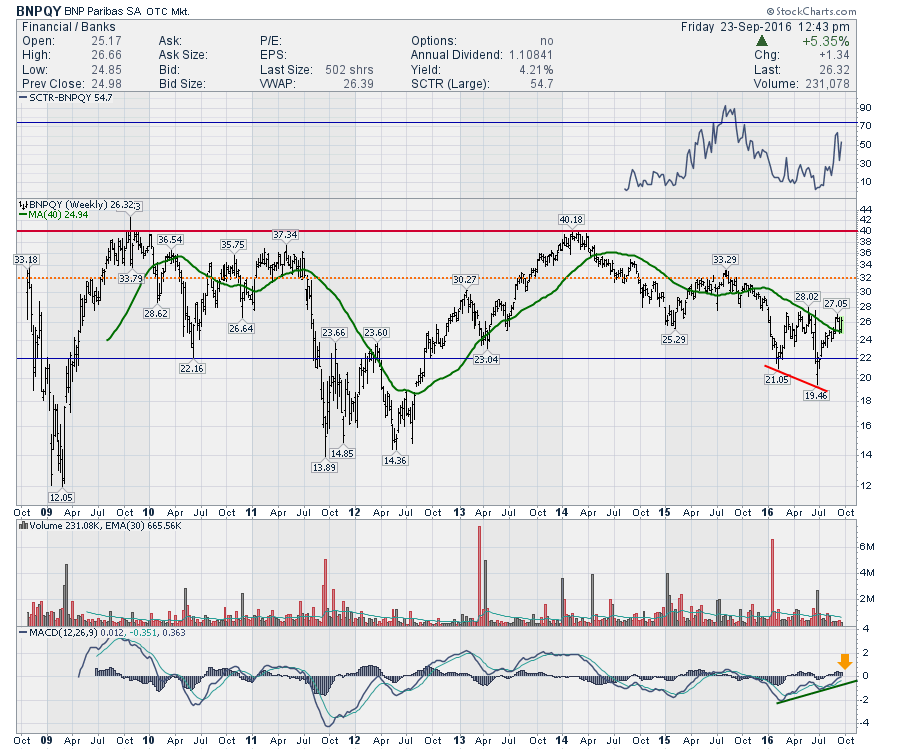
 Let's head over to the home of Euro 2016 and look at a French bank. BNP Paribas (BNPQY). With an SCTR of 54, we have a stock that is right around the middle of the pack. The stock had its lowest weekly close in 3 years on Brexit Friday. A series of lower lows and lower highs suggests a test of $14 could be coming, but there is some positive divergence showing on the MACD. At the Brexit low, the sell signal on the MACD looked like the direction would be lower. With this rally, some of the technicals have improved slightly, but this would need to start making higher highs and at least one higher low before we could get excited. Another positive is the break above the 40 WMA.
 Credit Agricole (CRARY) is below. The SCTR has rallied to 28 so this is an improvement from the Brexit low. The stock had the lowest weekly close in three years on Brexit. There is support around $4.50 but this looks tentative. The MACD is making higher highs so that is an improvement.
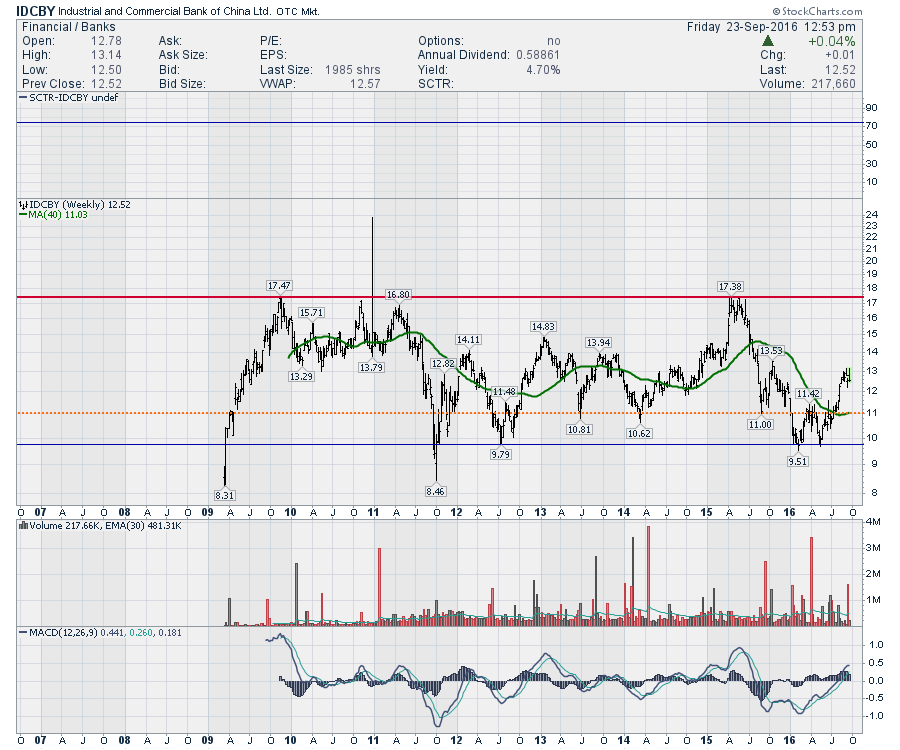
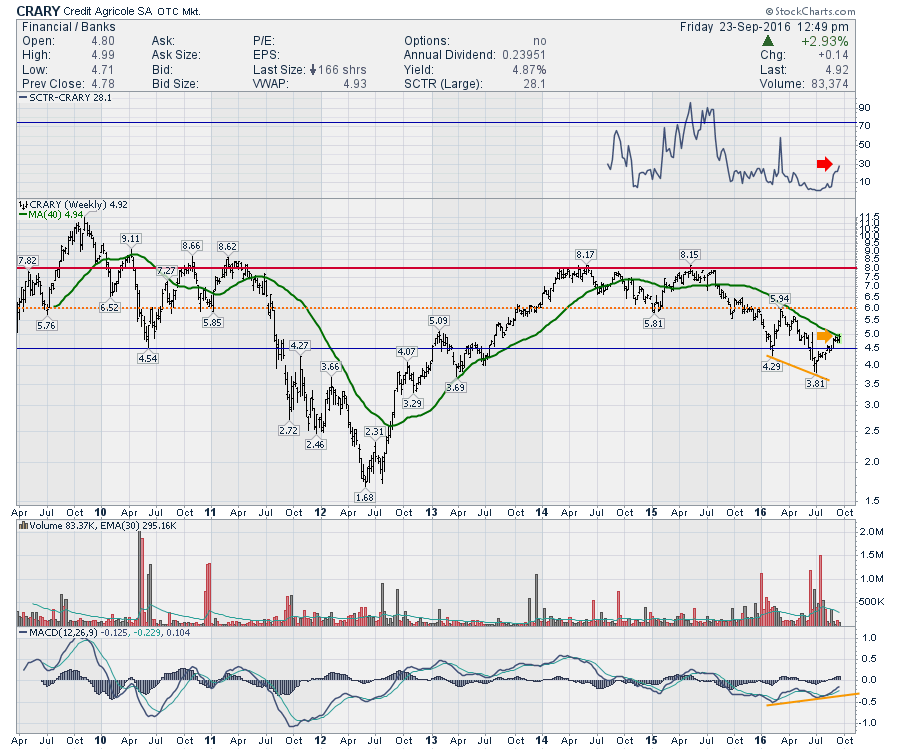 The Industrial and Commerical Bank of China (IDCBY) is the largest state-owned bank in China. We don't track an SCTR for this stock. The price has rallied to the middle of the 5-year range. The rally was impressive, but this still does not look like a great stock to invest in. I am slightly more impressed as the MACD is above zero which is not the case with most of the Eurozone banks.
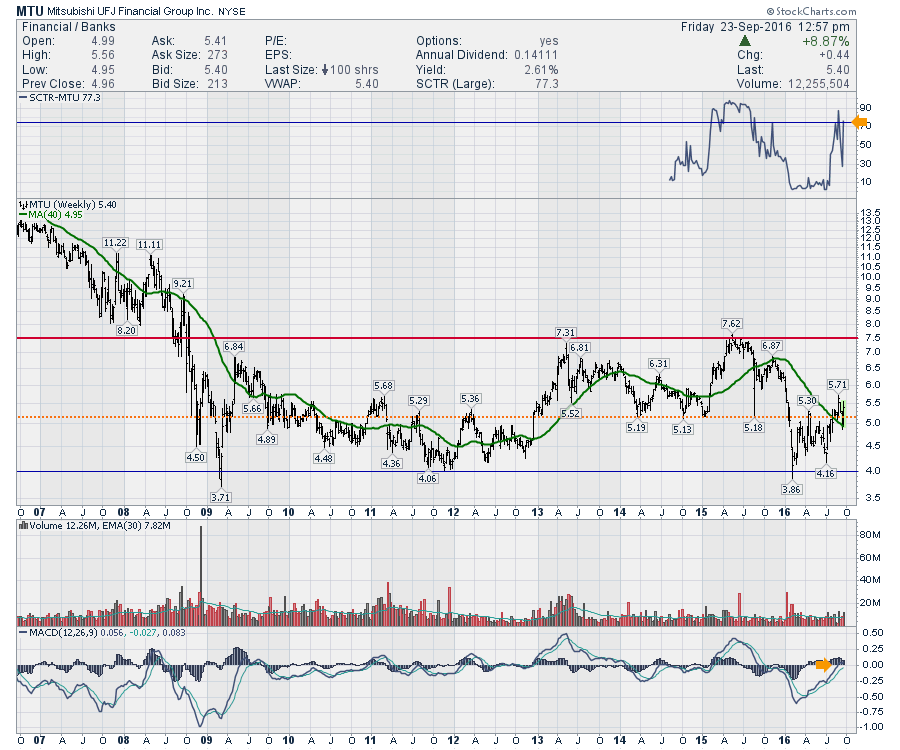
 Lastly, I'll finish in Japan. Mitsubishi UFJ Financial Group (MTU) is the fourth largest bank in the world. With an SCTR of 77.3, it has one of the best SCTR scores we have seen. It is also creating a series of higher highs and higher lows. It is currently above the orange support / resistance line and has found support on the 40 WMA. The MACD is right around the zero level so we will be watching to see if it can actually get some positive momentum going.
 The bottom line:
These charts are bouncing off the Brexit low. Many of them have hit some form of resistance. A few are above the resistance level. What is concerning are the RBS, CS and DB charts. Making a new low on the DB chart is really not encouraging.
No banker will hold up an exit sign on their stock, but collectively as a group, these stocks are a continuing area of potential global risk. Only a few had an SCTR above 50.
Feel free to pass this article on to friends and family. Feel free to comment below. If you would like to receive future articles by email, click on the Yes button below. I do roughly one-two articles a week from each blog (Commodities Countdown, The Canadian Technician, Don't Ignore This Chart) so you need to subscribe to each one individually. I also do a couple of webinars each week and you can view those live or in our webinar archives.
If you are looking for someone to tell you when to be cautious, this is still the time. That does not mean sell everything. It does mean make sure you are only in the strongest stocks to support your dividends and minimize downside risk.
Good trading,
Greg Schnell, CMT, MFTA.
